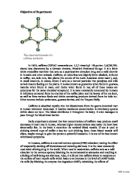
- Quaternary structures: this is where the molecule is made up of two or more polypeptide chains. Example is a haemoglobin molecule.
For this plan, I will use rennin (chymosin) as an enzyme to coagulate milk. As with most enzymes, rennin works best at optimum temperature of 37º C. Rennin will act as a constant in this experiment, whilst the variable will be the concentration of calcium ions in the form of calcium chloride.
During the process of coagulation, rennin splits the soluble part of casein, k-casein. This causes an imbalance in the intermolecular forces of the protein. Casein contains high number of proline bonds that have no interactions. Therefore it is relatively hydrophobic when calcium ions are added to the protein. As the reaction occurs, flecks of curd can be seen as they are not hydrophilic.
Prediction: My prediction is that the higher the concentration of calcium ions, the quicker the rate of coagulation. This is because at higher concentration, there will be a large amount of calcium ions to react with casein.
Risk Assessment: Sodium citrate is irritant when exposed to the skin. CaCl2 is also irritant to skin and eyes. However lower concentration will not pose any real threat although precautionary measures must be taken. Therefore, goggles and lab coats must be worn.
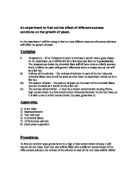
Apparatus:
Rennin solution 1ml syringe
Milk 5ml syringe
Sodium citrate 10ml syringe
Testubes 50cm³ beakers
1.0 mol dm of calcium chloride 50cm³ measuring cylinder
Distilled water Microscope
Microscope slides Plastic Pipette
Stop clock
Method of Dilution:
As only 1.0 mole dm-3 of CaCl2 is provided, I need to dilute it down to several concentrations. However, from preliminary testing, I found that 1.0 mol dm-3 is far too strong for the reaction as it forms flecks of curd instantly. Therefore I have decided to have my highest concentration as 0.5 moles dm-3. In order to dilute, I will have a total of 20cm³ solutions of calcium chloride and water. To get different concentrations, I will change the ratio of CaCl2 to water. I will have 5 different concentrations of CaCl2:
0.5, 0.25, 0.125, 0.1, 0.0625 moles dm-3
Table of Dilution:
The sixth testube will act as a control tube and will aid for comparison in terms of the formation of curd.
Testube 1: using a 10ml syringe, add 10cm³ of CaCl2 and 10cm³of water.
Testube 2: using a 5ml syringe, add 5cm³ of CaCl2 and using10ml syringe, add 15cm³ of water.
Testube 3: using a 5ml syringe, add 2.5cm³ of CaCl2 and using 10ml syringe, add 17.5cm³ of water.
Testube 4: using a 5ml syringe, add 2cm³ of CaCl2 and using 10ml syringe, add 18cm³ of water.
Testube 5: using a 1ml syringe, add 1.25cm³ of CaCl2 and using both, 1ml and 10ml syringe, add 18.75cm³ of water.
Testube 6: using a 10ml syringe, add 20cm³ of water.
Method of Coagulation:
In order to make this a fair test, I will have a constant volume of milk as well as the volume of rennin. This will be 10cm³ of milk and 1cm³ drops of rennin as tested in the preliminary. Firstly, I need to remove the calcium ions present in milk. This will be done by adding 1cm³ of sodium citrate into each beaker of 10cm³ of milk. Therefore,
- Add 10cm³ of milk into six 50cm³ beakers using a 10ml syringe.
- Then add 1cm³ of sodium citrate into each of the beakers using a 1ml syringe.
The only problem with this method is that it is impossible to identify whether all of the calcium ions are removed or not as it depends on the quality of milk and the concentration of calcium ions. This varies from batch to batch. Therefore, I will have to assume that all calcium ions are removed. Then,
- Using a 1ml syringe, add 1cm³ of Rennin into each beakers containing milk.
-
For each of the beaker, add different concentrations of CaCl2 respectively using a 50cm³ measuring cylinder and start recording the time.
-
As soon as the different concentrations of CaCl2 is added, dip a microscope slide in to the solution, remove it and observe it under a microscope to look for the appearance of flecks of curd. I will record the time it takes for flecks of curd to appear.
Diagram:
I will repeat the above experiment at least three times in order to get reliable information.
Results Table:
Graph:
References:
-
Risk Assessment for Sodium Citrate, retrieved 29th April 2008,
-
Risk Assessment for Calcium chloride, retrieved 29th April 2008,
Process of Coagulation, retrieved 29th April 2008,
-
Protein Structures, retrieved 30th April 2008,
Biology 1 by Mary Jones, pages 31-34
-
Enzymes, retrieved 30th April 2008,
Biology 1 by Mary Jones, page 46
-
Coagulation of Milk, retrieved 30th April 2008,
Advanced Biology by Michael Kent, pages 378 - 379