Hypothesis
My prediction of this experiment is that the stronger the concentration of the substrate (H2O2), the faster the reaction will become. Water does not react with the peas and therefore will slow the reaction down. This is because there is a less chance of the enzyme and substrate colliding together in order to react.
This is the formula used in this reaction:
catalase
Hydrogen Peroxide water + oxygen
catalase
H2O2 H2O + O2
The water will slow down the reaction as it will dilute the H2O2 down and because the outcome is water and oxygen it will just mean that there is already water in the substrate, so therefore it will make less.
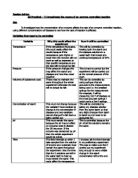
Fair Test
I will keep my experiment a fair test by:
- Keeping the temperature constant – I will keep the temperature at room temperature as enzymes are affected by temperature. (If my results do differ then I know that this will be due to the room temperature changing). Temperature affects enzyme reaction because if the enzymes are being heated up during the experiment, then they will be ‘destroyed’ and not work to ‘the best’ they can.
- Keep the same weight of peas – I will keep the same amount of peas by crushing a large amount altogether so I know I have kept the thickness the same and weighed out an amount for each test tube. This will help me keep a constant enzyme and the weight will be 1g. It keeps the same concentration of thickness of peas this way too.
-
Keep the same volume of liquid – I will be using 5cm³ in each test tube and this way I know that I haven’t reduced the chances of collision and it is easier to measure out the right percentage of substrate or water.
Method
- Using the pestle and mortar, crush the soaked peas as small as I can to get the same consistency throughout, ensuring that all the skins have been peeled off and keeping the thickness of the ‘mush’ the same. You must make sure that all the skins are taken off as there are no enzymes in the skins and this could alter the results, by causing the enzymes to not react as quickly as I wanted them too or expected. Make sure there is nothing else added to the ‘mush’ before removing it from the mortar.
- Weigh out 1g of crushed peas into each test tube. Measure out the first amount of concentration of substrate and put into beaker. When I am ready I will add the substrate to the catalase and start the stopwatch.
- Record every 20 seconds how high the bubbles (of foam) have gone and record this in the table.
- Repeat 3. and 4. so that each of the concentrations of substrates have been done.
- Repeat the whole of the experiment twice more. I am repeating the experiment so I can see if I have any slight changes in repeating the experiment, also to ensure that there wasn’t something wrong with the first amount of peas used, or substrate.
Results Table
I have not done a test for 0% of H2O2 as I know that the reaction of the peas with the water would not take place. This is because water does not react with the crushed peas in the way that I want it to for my experiment and also the experiment is partially about the hydrogen peroxide and catalase reaction.
Repeats
These are the results from the repeat of the experiment:
From these results I can now compare and by doing so I need to put them into a graph.
(See next sheets for the graphs)
Review of Graphs
From the results I have placed in the graph I have noticed that the best correlation, and one that will match my prediction, was the graph for Results A. This was because all the results followed pretty much the same line angle and they all seem to be positive results. As I was plotting the graph I noticed that the ‘20%’ and the ‘40%’ started to cross over but the ‘average’ for the graph would tell me that it was a good set of results.
I found that the results from ‘Result B’ showed a very odd line and if I was to draw a line of best fit then I would notice that the lines cross each other frequently. The oddest results were for the ‘50%’ and ‘40%’ results had very strange end results compared to the rest. They went down instead of up as I would have expected them to. When plotted into the graph I can see that they have a steeper incline in the way they are set out.
I found that the results for ‘Result C’ start off with a bigger range of starting heights compared to each other and compared to the other tables. The results for the ‘100%’ were the oddest as if a line was connected through them then it would have crossed through some of the other results lines. The ‘60%’ results started and ended the highest out of all the results.
Analysis
I think that from my results and graphs i have enough evidence to say that my prediction of the stronger the concentration the faster the reaction has very little support if I was to use my graphs and tables. Even though I repeated my experiment, I still feel that I haven’t got sufficient evidence to prove my prediction correct. I think that all I can say from my results is that the stronger the concentration, the higher the bubbles that are produced will be after a period of time; even though this was not the case with the results from Table B.
The gas that was produced through the bubbles was, obviously, lower when the substrate had just been added and at its highest when the substrate had been given time to react. Also the stronger it was the more gas that was produced as the water diluted the hydrogen peroxide.
Evaluation
I feel that the experiment went relatively well and I only seemed to have a few odd results that seemed to stand out. I think I could have made my measurements more accurate as measuring them with a ruler up against the test tube was not very reliable and this could be one of the reasons why the results turned out odd. Next time I could use a piece of apparatus which has accurate markings up the side of it and out my enzymes and substrates into that and that way I could work out the height that the bubbles reached to and the height that the liquid ended up, whether it had been reduced. But I think that my measurements for the substrates were very accurate as I used a small, fine syringe for each liquid.
I think that my method was a good one although I think that I could have added one more thing and that would be to measure the temperature of the area I was working in and the temperature of the substrate I was adding to the enzyme as enzymes are affected by temperature as well. When enzymes reach a certain hot temperature the proteins break down and the enzymes active site changes and the enzyme has been de-natured. But as the temperature rises to the certain height, the reaction does speed up so next time I could also monitor the temperatures.
I don’t feel that my results were accurate enough, even though I repeated the experiment three times, to give an accurate conclusion or an accurate graph. I feel that they were affected by some other form of enzyme effects. If I am to repeat the experiment I need to look at the temperature and the pH as I think that it will come down to these being different. This would be the reason why the results are not accurate and why they seem to be different each time I have repeated them.