Jessica Ashton
AS Practical – To investigate the course of an enzyme controlled reaction
Aim
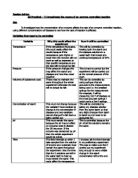
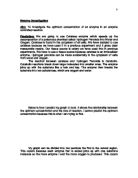
To investigate how the concentration of an enzyme affects the rate of an enzyme controlled reaction, using different concentrations of diastase to see how the rate of reaction is affected.
Variables that need to be controlled
Apparatus
- 11 cuvettes
- colorimeter
- starch suspension
- iodine solution
- stop clock
- Syringes – 1 cm³, 5cm³ and 15cm³. these syringes must be used to gain the most accurate measurements as possible
- 100 cm³ beaker
- Diastase concentrations at 0.2%, 0.4%, 0.6%, 0.8% and 1%. The table below shows how I will gain these concentrations from a 1% concentration of diastase.
Once I have got these concentrations I will have 10cm³ of diastase at each concentration. I only need 5cm³ so I need to only remove 5cm³ from the beaker.

Method
- Place 3cm³ of iodine solution in each cuvette.
- Using this iodine obtain a reading of 100% transmission on the colorimeter using a red filter (no.8).
- place the 5cm³ of 0.2% diastase and the 15cm³ of starch (200mg 100cm-³) into the 35°c water bath and leave to warm up for 5 minutes.
- After the 5 minutes place the diastase and the starch together in a beaker and start the stop clock.
- Immediately remove 0.5cm³ from the reacting mixture and add to a cuvette of iodine. Shake. Record the transmission value on the colorimeter.
- Repeat stage ...
This is a preview of the whole essay
Method
- Place 3cm³ of iodine solution in each cuvette.
- Using this iodine obtain a reading of 100% transmission on the colorimeter using a red filter (no.8).
- place the 5cm³ of 0.2% diastase and the 15cm³ of starch (200mg 100cm-³) into the 35°c water bath and leave to warm up for 5 minutes.
- After the 5 minutes place the diastase and the starch together in a beaker and start the stop clock.
- Immediately remove 0.5cm³ from the reacting mixture and add to a cuvette of iodine. Shake. Record the transmission value on the colorimeter.
- Repeat stage 5 every minute for 10 minutes.
- Then repeat stages 5 and 6 another 2 times so that 3 lots of results for 0.2% diastase are gained.
- Work out the average of these results and record it in a table.
- Repeat stages 5, 6, 7 and 8 with diastase concentrations of 0.4%, 0.6%, 0.8% and 1%.
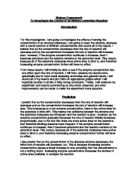
I want this method to show how much starch is broken down by the diastase at different concentrations of diastase. I used a similar method in preliminary work to see how temperature affects the rate of an enzyme controlled reaction, and found that this method worked well, so I decided to adapt it to investigate the course of an enzyme controlled reaction when the enzyme concentration is changed.
Risk assessment
- Obey lab rules at all times
- Try not to get iodine on the skin as it is an irritant and can stain the skin yellow
- Be careful not to get any of the chemicals in your eyes, if so wash out immediately.
Background knowledge
Enzymes are catalysts. Catalysts speed up chemical reactions that would normally happen very slowly. Enzyme molecules have a complicated three-dimensional shape due to the particular way the amino acid chain, which makes up the protein, is folded. This tertiary structure gives the enzyme its catalytic ability. A few of the amino acids on the surface of the molecule fold inwards to make a specific indentation, called an active site, into which a particular enzyme can fit. Once the enzyme and substrate are joined they form an enzyme-substrate complex. The formation of the enzyme-substrate complex makes it possible for substrate molecules to be brought together to form a product. The product is released and the enzyme is free again to take part in another reaction.
An enzyme molecule is globular and very large but only a small part of it, the active site, is involved in the reaction.
The substrate molecule fits into the active site and is held there until the reaction is complete. The product is then released and the enzyme is once again ready to take part in the reaction. This is known as the lock and key hypothesis. The active site has a distinct shape rather like a lock. Just as only the right key will fit a lock, so only the right substrate has the right shape to fit into the active site.
Prediction
I predict that the higher the concentration of the diastase the more starch it will break down. I think this will happen because when the concentration of diastase is low; there will not be many diastase molecules in the solution. This means that the diastase and starch molecules are less likely to collide so less enzyme-substrate complexes will be formed. When a higher concentration of enzyme is used, there will be more enzyme molecules in the reacting solution. Collisions will happen more frequently, so this means that substrate molecules will enter the active site more often.
Therefore more enzyme-substrate complexes will be formed. When there are so many molecules of diastase in the solution that all the active sites are in use and there is no longer any starch molecules left, then the maximum amount of product will be produced. Therefore I predict that at lower concentrations of diastase, the starch concentration left in the iodine will be quite high because there will be less molecules to break down the starch. This means that the percentage transmission reading on the colorimeter will be low. But as the concentration of diastase is increased, there will be more diastase molecules present in the solution. This means that there will be more diastase molecules to break down the starch molecules. Therefore starch concentration will be lower at the end of the ten minutes so the percentage transmission reading on the colorimeter will be higher.
I will use a graph to convert the transmission reading from the colorimeter into a starch concentration. When I have these results I can work out the rates of reactions for the different concentrations. So when there is a high concentration of enzyme, more enzyme-substrate complexes will be formed at a faster rate than at lower concentrations. Therefore I predict that the higher the enzyme concentration, the faster the rate of reaction will be.
I found information from the following sources:
Mary Jones, Richard Fosbery, Dennis Taylor. (2000). Cambridge Advanced Sciences Biology 1.
ISBN 0 521 78719 X
MSN Learning & Research. Encyclopedia article from Encarta, Enzyme
http://www.encarta.com/encnet/refpages/RefArticle.aspx?refid=761575875
Results
This next table shows the average of the three sets of results I have shown above.
I used the conversion graph to convert the transmission readings taken from the colorimeter to starch concentration and these are the results I gained.
I then put these results onto a graph which I have enclosed.
From the graph I can work out the rate of the reactions by calculating the gradient of the slopes of the graph. I have recorded the gradients in a table.
All the rates are taken 1 minute after the reaction has started. I did this because this is where the reaction will be most accurate and at it’s fastest.
Conclusion
From the table above I can see that the higher the concentration of enzyme, the greater the gradient therefore the faster the rate of reaction. When there were more enzymes in the reacting solution, the concentration of diastase was higher. This meant that the diastase and starch molecules were more likely to collide, so more enzyme-substrate complexes would be formed, which means more product. Therefore if more product was made at higher concentrations, this means that there would be less starch left in the solution after 10 minutes. This is shown on the percentage transmission readings on the colorimeter. The higher the transmission reading, the less starch was left in the mixture. This can also be looked at from lower concentrations. The lower the concentration, the less diastase molecules were in the reacting solution. This meant that the diastase and starch molecules were less likely to collide so less enzyme-substrate complexes would be made. Therefore less product was made. This meant that there would be more starch left in the solution after the 10 minutes was up. So therefore the reading on the colorimeter was lower because there was more starch left in the reacting mixture. This means that my prediction was correct. The higher the concentration of diastase, the faster the rate of reaction would be.
The graph levels off earlier with higher concentrations because there are more diastase molecules in the solution to bind with the starch molecules. Because there is the same amount of starch when each reaction with different concentrations, when there are more diastase molecules, the starch will be used up quicker. The graph leveling off shows that most of the starch is used up and only iodine is left in the cuvette when the transmission reading is taken.
Evaluation
I think my data is reliable because it matches the prediction I made. On the graph I have drawn, all but one of the results lie on the line of best fit. I have circled the result that doesn’t lie on the line of best fit, as this is an anomalous result. There could be many reasons for the inaccuracy of this result. As the transmission readings were getting higher, this one seemed to increase slightly where it shouldn’t have.
I think the most valid reason for this inaccuracy is that I could have taken the measurement from the reacting solution too early. This would mean there wasn’t a full minute between one measurement being removed and the next.
This would mean that there wasn’t enough time for the diastase and starch to bind and produce a product. Therefore when the reading was taken there was still a small excess amount of starch still left in the solution that may not have been there if the reading was taken at the exact time interval.
When reviewing the practical procedure that I used, there are some limitations in the method. Because I had to carry out the experiment over a few lessons, this meant that the water bath that I used might have not been at exactly 35°c because the temperature may have fluctuated slightly.
The accuracy of the colorimeter could also be a limitation. I made sure I used the same colorimeter throughout the experiment, but the colorimeter itself may have slight fluctuations. I was unable to have any effect on this myself, but the fact that it might not be 100% accurate all the time needed to be taken into account.
When taking all measurements I tried my best to be as precise as possible, but there may be room for error. When taking readings from the colorimeter, the needle tended to wobble a bit from left to right before it would settle on the correct measurement. I made sure that when taking all readings that I waited until the needle had settled before recording any results.
When taking volumes of all the liquids used in the experiment I used the smallest syringe for the measurement I wanted to take, this would make any inaccuracies as small as possible.
I think the one of the limitations that would have the biggest effect on the experiment would be that of the temperature of the water baths because if the temperature gets higher or lower it would have an effect on the rate of reaction because if the temperature increased then the molecules in the solution would have more kinetic energy so they would more likely to collide with each other and form more enzyme-substrate complexes. If the temperature dropped then the molecules would have less kinetic energy so they would be less likely to collide, so less product would be made. To make this less of a limitation next time I would make sure I used the same water bath and make sure a constant temperature of 35°c was maintained. If this was done there would be a smaller chance of anomalous results.
The second of the limitations that would have the biggest effect are the measurements of the volumes. Making sure that all the measurements that were taken were as precise as possible and to make it even more precise, using the smallest syringe for that measurement. This makes inaccuracies as small as possible. To make this better next time I would make sure my measurement taking was as precise as possible and double check it was correct before putting it into any mixtures.
Most of these limitations are fairly small and don’t have any major effect on the results. Therefore I can say that the limitations and inaccuracies found in the method were not significant enough as to have an effect on my final results.