4x potatoes
1x bore
1x scalpel
1x pepite
1x ruler
1x scales
6x different concentrated solutions
Method: I am going to try and effect osmosis by using different concentration levels in six different test tubes. I am doing this experiment in room conditions. Potatoes must be cut very carefully to get a correct result. I shall cut 6x5cm bars using a scalpel to cut and a ruler to measure. Then I shall number each bar, 1, 2, 3, 4, 5, or six. I shall then number each test tube in the same way. Carefully, I shall use the pepite to measure 10ml of each kind of solution into each test-tube. I shall put the different solutions in this order:
Test-tube 1: 0.0 mol of sucrose solution
Test-tube 2: 0.2 mol of sucrose solution
Test-tube 3: 0.4 mol of sucrose solution
Test-tube 4: 0.6 mol of sucrose solution
Test-tube 5: 0.8 mol of sucrose solution
Test-tube 6: 1.0 mol of sucrose solution
After that is complete we must check that the potatoes are all healthy and if we find any rotten or unhealthy potato bars we shall place them in the bin and cut a new bar out. After each bar is healthy I shall cut each of them into 5x1cm to increase the surface area. I shall then weigh them and make sure that they are within 20mg of each other. The weight of which small 5x1cm shall be going in which test-tube, will be recorded so that I can find a correct reading when I find the results out. I shall put each 5x1cm blocks in order and leave them for 1hour and 30 minutes.
After this time is over I will take them out and put each set on a paper towel each. I shall leave them for five minutes and then weigh them. If the mass is less it means that the osmosis process was helped by the sucrose. I shall work this out by dividing original weight by after experiment weight then times it by on hundred.
Fair Test: I shall make this a fair test by, making sure that nothing is changed apart from the amount of sucrose in the solution. I shall be repeating this whole experiment twice to make sure that I get a fair and average result.
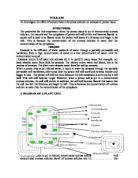
Osmosis: Osmosis is the movement of water molecules across a partially permeable membrane form a region of high water concentration to a region of low water concentration.
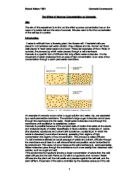
Here is a simple diagram showing the passage of osmosis:
Diagram:
Each one has a different sucrose
concentration ranging from 0.0-1.0.
They go up in 0.2 every time.
Results: Here are three tables and three graphs. There is one graph and one table for the results on each experiment and one average.
Experiment 1:
Experiment 2:
Average:
Conclusion:
Using this graph can see that the sucrose has made a definite and obvious difference. With 0.0 % sucrose (distilled water), the weight of the potato weight has gone up. This is due to the solution to travel freely along the osmosis passage (diagram shows this in osmosis section).
When the concentration level was 0.2 it shows that there was a slight change, in that the weight only goes up about 0.10 grammes. This because the solution is limited to how much it can travel along the osmosis passage (see diagram in osmosis section).
For the rest of the test tubes in each of the two experiments it is obvious that the passage of solution gets limited as the concentration contains more sucrose. This shows that sucrose is a strong solution and that it can not pass along the osmosis passage (see diagram in osmosis section).
Evaluation:
The stronger the solution of sucrose concentration, the less osmosis can happen.
AT1
INVESTIGATING OSMOSIS IN POTATOES!
BY ELLIOT SMITH