The pH level is a factor because enzymes will only function well at an optimum pH value; this is normally 7 because enzymes are proteins which are damaged by very acidic or very alkaline conditions. If the pH level changes then the enzymes become denatured and do not function properly, similarly to when they are denatured through high temperatures. The pH will inevitably change due to hydrogen ions being given off throughout the duration of the reaction. This will cause the solution to become more acidic, as hydrogen ions are what cause acidity. However, as for the temperature change, this will be the same for every reaction and is so insignificant that it is not worth the time and trouble to sort this out. In any case this factor is virtually unpreventable.
The Reaction:
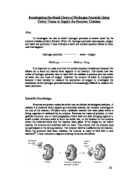
Catalase is found in the tissues of most living organisms, and is the enzyme which catalyses the breakdown of hydrogen peroxide into water and oxygen. Hydrogen peroxide is a toxic product of several different metabolic reactions within our bodies, and catalase is the enzyme used to convert it into oxygen and water. Without catalase, a dangerously high build up of hydrogen peroxide would occur inside our bodies. Without the catalase the reaction would occur so slowly that it would hardly make any difference, which is why enzymes are so important. Many enzymes are composed of different parts that help to perform different functions, in catalase there are four different units that perform these different functions, and each unit contains what is called a haem group. The haem group is responsible for carrying out the activity within the enzyme. Each unit uses the energy from the surrounding electrons to perform its function, in this case, the decomposition of hydrogen peroxide. The decomposition of the hydrogen peroxide comprises of two different types of reactions. There is oxidation which is a reaction that involves the loss of electrons, and also reduction which involves the gain of electrons. A combination of the two types of reactions can be called a redox reaction. This particular reaction is a fairly easy reaction to measure due to the oxygen that is released, and can then be collected and measured. Over periods of time the catalase can also decrease in activity in the same way as the hydrogen peroxide, due to oxidation(c).
Prediction:
I predict that as the enzyme concentration is increased then the rate of the substrate activity will also increase, because there will be more molecules of catalase, resulting in more chemical reactions being caused by successful collisions between the active site of the catalase and the hydrogen peroxide. I would also expect the highest concentration of the catalase to give a greater rate of reaction more quickly than the lower concentrations of catalase because it contains the most molecules. With more molecules it is given that there will be more collisions because there will be less space free of molecules. A molecule must collide with the substrate in order for it to react. This means that a reaction is more likely to happen in a shorter space of time, which is why the reaction speeds up when the concentration of the enzyme is increased. Therefore the more collisions that take place, the more oxygen that is produced, in a shorter quantity of time.
I have also managed to obtain a predicted graph for different levels of concentration that can be used to affect the rate of reaction. The graph shows different volumes of celery extract, containing catalase, that were added to the same volume of hydrogen peroxide each time. Water was also added to keep the total volume of the mixture the same in each case:
(5)
As you can see, the rate of the reaction and the volume of oxygen collected increases as the amount of celery extract increases. This shows what the effect of the enzyme really does. Because I have found these graphs as examples they do not show the same quantities as I intend to use. However, they do give the rough idea of how the rate of reaction should turn out.
I have also included a graph to show the calculated rate of reaction in the first 30 seconds of each enzyme concentration, to show how the rate of reaction is increased when more of the enzyme (catalase) is available:
(6)
As you can see from the diagram above, the amount that the enzyme concentration affects the rate of reaction is almost directly proportional.
The Method:
As I have chosen the concentration of the enzyme as my variable to be working with, I must also choose suitable apparatus to perform and measure the investigation. There are a few different ways of measuring the rate at which the reaction takes place. You can measure the pH level, which I feel is very hard work and quite inaccurate as there is a very small scale to work with. Another way to measure the rate of reaction is to weigh the beaker of the mixture throughout the reaction, however this is another inaccurate way of measurement because the change in the weight of the mixture due to the oxygen is so minimal compared to its volume, and at many intervals I would expect the weight to stay unchanged with the accuracy of weighing scales that I have at my disposal. It is also possible to measure the foam created on top of the mixture. However, I do not think that I will use this method of measurement because it is also a very inaccurate way to measure the rate of reaction, due to the amount of foam produced being quite temperamental. Due to these methods proving quite unreliable, I plan on measuring the volume of oxygen produced. However, it is possible to measure the volume of gas produced in a number of different ways:
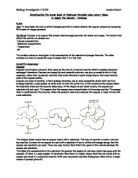
The main options that I am considering are; using an upturned measuring cylinder in a tray of water that is connected to the beaker that the reaction is taking place in, as shown below:
(7)
This method would be a very good option to choose because it enables me to see whether or not any gas is leaking from the cylinder because I am able to see bubbles escaping, this would possible allow my reaction to be more accurate. This set-up as you can see is quite difficult and time-consuming to set up each time. This is mainly due to it being hard to prevent there being any gas in the top of the measuring cylinder before I start, because it is hard to completely remove all the gas.
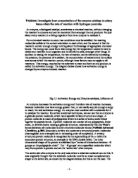
Another possible method would be to use a gas syringe, as shown below. This method has some advantages that the other does not. However it does not allow me to tell if there is any gas leaking from the syringe, which, although it is unlikely to happen, it is a possibility. This method is more accurate because the syringe has more markings of measurement and this allows the readings to be more accurate, giving a higher accuracy of the readings. I have shown a diagram of the apparatus below to give an idea of what my experiment will look like:
(8)
This method of measurement is the one I have chosen, because it is quicker and easier to set up and repeat many times in quick succession, which is a real benefit due to only having 100 minutes to finish all my reactions that I plan on investigating.
Safety Precautions:
Hydrogen peroxide and its decomposition products are not systematic poisons but contact with hydrogen peroxide can be irritating. Concentrated vapours cause discomfort in the mucous membranes and the eyes. Contact of the eyes with hydrogen peroxide is particularly dangerous because corneal burns can occur very rapidly. Therefore, it is imperative that safety glasses or, preferably, goggles should always be worn when handling concentrated hydrogen peroxide. If, however, any hydrogen peroxide does get in the eyes, they must be flushed thoroughly with water. Due to this I shall be sure to always be wearing goggles within the lab environment, and to be especially careful when handling the hydrogen peroxide. If, however, the hydrogen peroxide is spilt I shall be careful to immediately clean it up, making sure to use gloves, so as not to get it on my hands.
Only very few enzymes present hazards, because of their catalytic activity, to those handling them in normal circumstances but there are several areas of potential hazard arising from their chemical nature and source. These are allergenicity, activity-related toxicity, residual microbiological activity, and chemical toxicity. However, these are such rare occurrences that it is not as dangerous as the hydrogen peroxide, and will have little, if no affect on most people. However, I will still ensure to be careful when handling the enzyme solution.
Preliminary:
It is imperative to ensure that the method of investigation is chosen correctly to allow for ease of method, and also accuracy. A preliminary experiment is also important to get an idea of how much of each solution should be used, and then at what strengths to use it. My initial idea was to use 5 different strengths of the catalase solution repeating the reaction of each strength, 3 times and then calculating the average of those results. I plan on using 10cm³ of catalase solution for each reaction, because I feel that this is a large enough figure to give good results, and not too large that it will be too time consuming to repeat the experiment each time.
I plan on starting, by using 10cm³ of just the catalase solution and then 8cm³ of the catalase with 2cm³ of water. This will keep the volume of catalase solution equal for each reaction and decrease the strength of the solution at the same time. I will then go on to use 6cm³ of enzyme solution with 4cm³ of water, then 4cm³ of the enzyme solution and 6cm³ of water, and finally 2cm³ of the enzyme solution and 8cm³ of distilled water. These measurements allow me to decrease the concentration of the enzyme solution whilst keeping the volume at a steady figure. I have included a table to show my quantities of dilution to make it clearer and easier to understand what I will be doing:
Table of dilutions to show the concentrations of the catalase solution I shall use to mix with varying amounts of distilled water:
This table clearly states the volumes of solution I will be using and it is made clear that each different dilution of the stock solution adds up to 10.00cm³. I have chosen to use five different concentrations because I feel that this should be enough to give me a good idea of how the reaction rate is affected by the concentration of the solution. I shall be carrying out three preliminary experiments to test how suitable the concentrations that I have chosen are, and also to make sure that the reaction does not happen too fast or slow. Both of these, if the experiment takes too long, would not be suitable because of the limited time that I have to do the tests, and if the reaction was too fast then the accuracy of the experiment could be affected, due to it being difficult to measure accurately. I plan on doing just 3 preliminary experiments due to my lack of time to complete these procedures. I have chosen to use the most concentrated solution (100% enzyme), the middle solution (60% enzyme and 40% water), and finally the weakest concentration (20% enzyme and 80% water). This should give me a good representation of the results I will be getting.
I must also decide on the total volume of hydrogen peroxide that is to be added to the enzyme solution in each experiment. I must make sure that it is a large enough figure for the reaction to happen at a reasonable speed and accuracy. Due to it being important that there is more hydrogen peroxide than catalase, because there is need of excess substrate for the enzyme to work most efficiently, I shall be using 20.0cm³ of hydrogen peroxide in my preliminary experiments. This will allow me to judge whether or not it is a suitable amount once my preliminary experiments are complete. It is important to keep the volume of the substrate constant so as not to affect the accuracy of the experiment. I shall measure all the volumes that I am using, using varying glass pipettes of appropriate sizes.
Apparatus:
- 250.0cm³ of celery extract containing catalase
- 500.0cm³ of hydrogen peroxide
- 250.0cm³ of distilled water
- Stop watch
- 250.0cm³ conical flask
- 3 x 250.0cm³ beakers
- Bung with hole to allow for glass pipe connection to rubber tube
- Glass pipe
- Rubber tube
- Clamp
- Clamp stand
- 10.0cm³ variable pipette
- 20.0cm³ variable pipette
- 2 x Variable pipette fillers
Carrying out the Preliminary:
In the preliminary work a range of concentrations need to be tested to ensure that when the experiment is carried out and the results recorded the range of concentrations will give good accurate results, with a range wide enough to make a fair test and give a correct conclusion. I have decided to measure the volume of oxygen gas produced every 10 seconds, until the reaction has been going for a whole minute. This is because I don’t have enough time to record the reaction until it stops, and it is also long enough to give a good idea of the rate of reaction. Below I have included a table of my preliminary results:
Table to show the results of preliminary testing of three different concentrations of the dilute catalase solution when mixed with 20.0cm³ of hydrogen peroxide:
The results shown above for my preliminary experiments seem to be suitable. This is because the maximum quantity of gas produced is well within the maximum limit of the gas syringe I am using (100cm³), and the weakest concentration gives a readable change in the quantity of oxygen gas produced at every stage. I am also pleased that the reaction has not occurred too quickly or too slowly for any of my concentrations, because it would be useless if every reaction had finished after just 20 seconds and would also be useless if they took 30 seconds to get the first reading. I am very pleased with my preliminary results, as they show a large margin of the volume of gas produced, between different concentrations, thus proving the substantial effects of enzyme activity.
The Procedure:
I shall now carry out the experiments in full, including every enzyme concentration. I will repeat each experiment for each concentration 3 times and then calculate an average volume produced for that concentration. I started by rinsing out all the equipment I used in my preliminaries and then poured out the correct measurements of the full concentration of enzyme solution to do the first 3 reactions. I then calculated the average of the results and proceeded to repeat the whole process again, with a lower concentration each time, until all the different concentrations of the catalase solution had been tested. My results from these experiments are shown on the next page.
Two tables to show the results obtained from my investigation into the rate of reaction that hydrogen peroxide is decomposed by, when mixed with 5 varying concentrations of dilute catalase solution:
Analysis:
My initial thoughts on my results are that they seem to fit my predictions quite accurately. This is to say that there is clearly a fairly strong positive correlation between my results. I also noticed that overall, my preliminary tests seemed to give higher outcomes, except for one exception. I have realised that this will have been due to the natural decomposition of the hydrogen peroxide through the collision of molecules, even without the enzyme that is inevitable. However, due to the rate of reaction without an enzyme being so slow it is not very significant. This was caused because I did my preliminary reactions at different times in one day due to lack of time, and had to go back to doing the main procedure a couple of hours after I had done my preliminary. This time delay in my work will be the reason for the less active substrate solution, causing my results to be lower. However, even though the results are slightly lower, there is still a large margin of difference between the volumes produced by different concentrations of the catalase solution. I am pleased with this because, as in the preliminary, it proves that the enzyme concentration affects the rate of reaction. I have also noticed that much more oxygen is released in the first 10 seconds than any other time during the experiment, this will be due to there being most molecules in the solution that have not yet reacted, and it is also possible that it is partly due to air being expelled when the bung is placed in the conical flask, causing the air to be displaced into the gas syringe.
From my results I am able to see that my procedure has gone to plan, as the results I have achieved are as I had expected. I am also pleased that there do not appear to be any anomalous results, which shows that my procedure was fair and relatively accurate, due to my method proving to have no significant faults. However, even though there do not appear to be any anomalous results from looking at the table, drawing graphs of my results would be much clearer, with the aid of a line of best fit, once I have completed all the graphs. If, however, there is any anomalous data within certain concentration categories, the averages of the concentration categories should even these out and create a good line of best fit. On the following page I have drawn a graph to show the data that I collected, from this graph I will be able to see the data more clearly in comparison to each other. I shall also draw a graph to show the initial rate of reaction for each concentration that will follow the other graph.
I have now noticed that there are a few anomalous results that have occurred during my procedure. There are some results on the initial rate of reactions graph that are not quite on the line of best fit. However, they are so minimal that they are almost not anomalous. I calculated the initial rate of reaction for each concentration by calculating the tangent of the gradient. This will give me the best and most accurate results for the initial rate of reaction.
There are also a few anomalies that are shown in the graph to show the volumes of oxygen produced. They occur in two different concentrations. However, they are so minimal and only occur once in two of the concentrations that I do not feel it is important to regard them too highly. I think that they could have been caused by inaccurate readings of the gas syringe, and are therefore only due to human error, not procedural error.
From my graphs it is easy to see that my predicted results were quite accurate, and what I predicted did happen, although my results were more reactive than I had predicted them to be. From my graph I can see that there are one or two small anomalies. However, these anomalies are so few and not very far off the line of best fit that I think it is best to overlook these results, as they do not fit into the trend.
Evaluation:
In the analysis I noticed that there were a few anomalous results, which are in some way connected to the method. In the evaluation I will investigate these as well as finding out possible improvements.
The inaccuracies of the experiment:
The results collected were fairly reliable, meaning that they were mostly expected. However, there were some inaccuracies in the experiment due to human error but no anomalous results. However the accuracy of the results could have been improved further by repeating the experiment again. The different enzyme concentrations were all kept under the same conditions, as was the substrate. I insured the Hydrogen peroxide and celery came from the same place so the results could be as reliable as possible. However, there was some natural decomposition that occurred through the duration of my experiment, which explains the fall in activity between my preliminary experiments and my actual procedure. It is also possible that the quantity of enzymes within any given volume of the solution could be different to another sample of the same enzyme solution with the same volume. This means that different parts of the solution could be more reactive than another, which could have caused slight inaccuracies. To try and prevent this I shook up the enzyme solution for each experiment before adding the substrate. Any slight differences in these results could also be due to human reaction time. I tried to avoid this by having an assistant to help me during the reading of my measurements, and also to help assemble everything, but even so some slight inaccuracies could have been caused by human error. However, if there are any, they are so insignificant that it is relatively unimportant. Overall I think that the results obtained and the graph, show a clear evidence for the experiment, and demonstrate how enzyme concentration can affect the rate of reaction. Effective and reliable conclusions can be drawn from this investigation. This is because they show a good correlation and prove that my predictions were correct.
How I would improve my method:
There were some aspects of the procedure of this investigation had significant limitations, such as the fact that I had initially decided to measure the volume every 10 seconds, which proved to be too difficult to do by myself. However I managed to sort it out by getting an assistant to help me with my experiments, but only if I helped them with the same problem. This effectively cut the time I had in half, which prevented the investigation from being carried out more extensively, and for a longer period of time. If more time had been given it would have been possible to sort out any anomalous data that had been found, and also extend the investigation. Another solution to the problem would have been to have 15 second intervals, instead of 10, which would have allowed me enough time to do it on my own. I think that these improvements to the procedure would help me to increase the reliability by allowing me to have more time to correct anomalies and, in turn increase the reliability of the experiment.
My first alteration to the experiment is that I would repeat the experiment again for the two concentrations that had the widest result range. Therefore, when finding the average volume of oxygen produced, the results would be more valid. In this experiment 5 enzyme concentrations were considered. However, although there was a fairly large range, in a future investigation, a far greater number of enzyme concentrations between those already recorded should be tested reducing the extent of any anomalies on a graph where the line of best fit must be drawn. This would mean that the graph drawn could be more complete, and better results would be obtained. I would only have been able to test 9cm3 of the catalase solution with 1cm3 of water, 7cm3 of the catalase solution with 3cm3 of water, 5cm3 of the catalase solution with 5cm3 of water, 3cm3 of the catalase solution with 7cm3 of water, and 1cm3 of the catalase solution with 9cm3 of water. If I had had time I would have liked to have tested these concentrations. This would have allowed me to obtain more conclusive evidence towards the rates of the reactions.
I think that the anomalous data that I have is only due to small procedural errors and has not had a huge affect on the validity of the conclusions drawn, because the trends in the data is still the same as it would have been without the anomalous data.
In this investigation each reading was repeated so that an average rate of reaction for each substrate concentration could be calculated. This could be improved by repeating the reading more frequently thus reducing the extent of any anomalies further, once averaged.
Finally I think had smaller quantities of hydrogen peroxide solution and celery solution been used a greater range of values could have been tested giving a more extensive graph.
Overall I think that the experiment was completed to the best of its potential, and that the results were sound, and accurate enough to prove my theory, that as the enzyme concentration increases so does the volume of O2 produced, because the rate of reaction has increased. This is because there are more active enzyme sites to react with the molecules of hydrogen peroxide, which means there are more collisions resulting in more successful reactions, which produces more oxygen. The results were all fairly accurate, the only ones which could be slightly inaccurate, are a couple which were taken at a concentration of 8cm3 of catalase solution to 2cm3 of distilled water, and also 6cm³ of catalase solution and 4cm³ of distilled water. The results for this concentration are very similar though which suggests there were not too many mistakes.
Extending the investigation:
If I were to extend this investigation I would repeat the same experiment but keep the enzyme concentration the same and instead change the substrate concentration. The substrate concentration experiment should have similar results to this experiment based on the collision theory and providing there were a sufficient number of substrate molecules for the enzyme to react with. Also if the equipment and variables were all kept the same except obviously the substrate concentration, then the results could be compared to this experiment, which would show whether changing the enzyme or substrate concentration had a greater effect on the rate of reaction.
I would also investigate the catalase content of other foods, such as liver and potato, which contain the enzyme catalase. I would use the same method as I did for the celery, as this would make the test fair. I would use the same concentrations as I used for the previous experiment to keep it a fair test, and also add the same amount of hydrogen peroxide. This would be timed for 1 minute and the volume of oxygen produced recorded using a gas syringe. The experiment would be repeated using the 5 enzyme concentrations used for the celery solution. The experiment would be repeated 3 times for each concentration so that the average volume of oxygen produced could be recorded. The rate of reaction would also be worked out, so as to compare the results. This data would be presented on a graph, which could then be easily compared to the reaction rate of the celery solution. From the conclusions drawn from the graph it should be possible to tell whether liver, potato or celery contained more catalase.
I would also like to investigate the effect of temperature on the break down of hydrogen peroxide using celery tissue to supply the enzyme, catalase. This would show greater depth into the topic and hopefully provide more conclusive results as to the conditions needed for the optimum yield of the products given off when hydrogen peroxide reacts with catalase.
From background research it is possible to discover that a rise in temperature increases the rate of enzyme-controlled reactions; a fall in temperature slows them down. In many cases a rise of 10oC will double the rate of reaction, but above 50oC the enzymes, being proteins, are denatured and stop working.
Knowing this, it is possible to compose an experiment which will test if the above information is true for the enzyme, catalase and work out the temperature at which the rate of reaction is highest.
Conclusion:
From my results I am able to compare the different concentrations, and have come to the conclusion that the rate of oxygen produced is directly proportional to, and is influenced by the decomposition of the hydrogen peroxide by catalase. The predicted graphs were also very similar to the ones that my results produced, proving that my investigation was conducted fairly and effectively.
Bibliography:
– Online image search. Images (2), (3), (4), (7) and (8).
Biology 1 – Textbook by Mary Jones, Richard Fosbery, and Dennis Taylor. Images (5) and (6). Information (a) pg??
Wikipedia Online encyclopaedia. Information (c) - http://en.wikipedia.org/wiki/Catalase
Physics For You – Textbook by Keith Johnson. Information (b) pg 19??