Preliminary Experiment - to investigate the effect change of temperature has on resistance in graphite.
Introduction:
I know that graphite is a semi-conductor from personal knowledge; what this means in terms of resistance is that although the amount of collisions between electrons and atoms increases as the temperature increases – due to an increase of kinetic energy in the structure, causing vibrations and leading to more collisions – more electrons are released from the structure of the graphite as free electrons which themselves can increase the flow of current. This means that either
• the rate at which resistance increases with an increase in temperature is decreased
•there is effectively no change in resistance with a change in temperature as the increase in collisions is proportional to the amount of extra current flowing through the material
•Or the effective resistance is actively decreased by increased temperature due to the extra flow of current.
The aim of this preliminary experiment is to find out how temperature change in the lab will affect the reliability of my results.
Method:
Apparatus:
• 500ml beaker
• Emersion heater
• ‘Easy-Read’ meter (set to measure resistance)
• Water
• Thermometer
• Graphite paper (same type as to be used in final experiment)
• Sticky-tape
• Modified bulldog clips (which can be used as part of the circuit)
• Wires
Steps:
• Fill a beaker with 400ml of water.
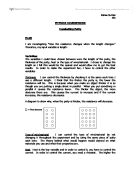
• Attach modified bulldog clips to either end of the graphite paper, and secure the strip round beaker (with a small gap where the two ends meet, allowing space for the clips) using sticky tape as shown below.
• Attach wires to ‘Easy-Read’ meter (set to measure resistance), and to bull dog clips to form a circuit (the meter has its own integrated battery).
• Measure the resistance at room temperature
• Place the thermometer and emersion heater in the water and turn on.
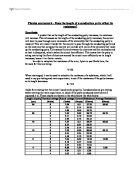
• The resistance should be measured over this range of temperatures as the temperature of the water in the beaker increases:
Results:
Conclusion of preliminary experiment:
As the maximum temperature change of the lab environment is only likely to be around a few degrees at the very most, my results suggest that the decrease of accuracy of my main experiment will be very small. For example, my graph shows that if there was a change of temperature from 20ºC to 22ºC in the lab, the accuracy of my results would 0.012kΩ too high, which would be a percentage error of around +0.36%. Therefore, in the context of this experiment, temperature will have almost no effect on the reliability of my results in the lab environment.
Method of main experiment
Apparatus:
• 2 Volt cyclon cell
• Analogue ammeter
• Digital voltmeter
• 45 cm strip of graphite-coated paper
• Rheostat (potential divider)
• Circuit wires
• Modified Bulldog clips (2)
The circuit should be assembled as shown above; the slide on the rheostat should always be adjusted so that the digital voltmeter reads 1 volt.
The current should be recorded for the following lengths of graphite paper:
As shown in the table, and as I wrote earlier, voltage must be kept constant to make this a fair experiment. Also, the width of the graphite paper must be kept constant throughout the experiment – easily done by simply using the same piece of graphite paper cut to shorter and shorter lengths.
These readings will be repeated 3 times to ensure a higher level of accuracy. The average of the three readings for each length will be used as my final values.
I have chosen an analogue ammeter, and digital voltmeter because from previous experiments they have been shown to be more accurate than their available alternatives.
The only real safety consideration is that the battery is not shorted; with the available equipment (which is very safe) this is only likely to happen if carried out purposefully.
Prediction of Experiment
I believe that if I decreased the length of the graphite paper, the resistance across the paper will decrease. This is because resistance is a result of collisions between electrons and metal ions in a lattice, therefore if the length decreases, there will be less collisions and a lower resistance. Using the same scientific background, I predict that if the length of the graphite paper was halved, the amount of collisions would halve, as would the resistance. Therefore, I predict that the resistance is directly proportional to the length of graphite paper.
Results and Analysis of Results
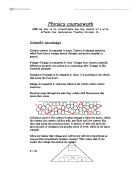
This graph shows how current decreases with an increase in length meaning that resistance increases with length; as R=V/I=VI-1 and as voltage was kept constant at 1 Volt in this experiment, effectively R=I-1. Because of this, and the line of best fit seems to suggest a ‘squared’ relationship, I believe a graph showing resistance against length would show a direct proportionality.
This graph shows that Resistance increases with length; it shows that resistance is directly proportional to length. Specifically for my width of graphite paper it shows that R= ~70*length. The fact that resistance has been shown to be directly proportional to length - in this case - fully supports my prediction.
This allows me to conclude that the scientific basis for my prediction was sound, and that the number of collisions between electrons and atom sites determines the value of resistance in a conductor.
Evaluation
As I found that my results fell in line with previous scientific knowledge, it suggests that my experiment was carried out accurately, and that the use of repeat readings is a good way of getting closer to the ‘ideal’ values which previous scientific study suggests I should be finding. The accuracy of my results also shows that my conclusions have a firm basis; by comparing my own personal results with others carrying out similar experiments, they seem to be similar enough to ensure that they are accurate. In order to make sure these results are reliable, even further amounts of readings could be taken using different sets of equipment to ensure that the experiment remains fair.