Apple juice is a very common industrial business. Millions and tons of apples are converted to juice each year and about 150cm³ of enzymes may be added to a tone of apples. I am going to test this claim by varying the concentration of Pectinase for a weighed quantity of apples.
Method:
In this investigation, I am going to make up my own concentrations of Pectinase from a single concentration of Pectinase supplied, and below is the method, and apparatus I am going to use in the investigation:
Requirements:
- Knife
- Ceramic tile
- Marking pen for glass (preferably black or blue)
- Beakers (100cm³)
- Electric balance
- Plastic syringes
- Pipettes (10ml)
- Glass rod x 2
- Water bath
- Medium sized glass, approx 10ml Measuring
- Large sized plastic or glass between 20-50ml Measuring
- Filter funnels
- Coffee filter papers
- Stop clock
- Pectinase (approx 150cm³)
Method:
(Set water bath to 40ºc)
- Label two beakers (100cm³), one ‘Pectinase’ and the other ‘control’.
- Chop medium sized apple into very small pieces, and distribute equally into the ‘Pectinase’ and ‘control’ beakers, adjusting the pieces until the masses of the two beakers are approx the same. I am going to measure the amount of apples, so that I use the same mass for each experiment. Measure 10cm³ of water and squirt onto the apple pieces in the beaker marked ‘control’ (i) Measure 2cm³ of Pectinase and 8cm³ water to make
(ii) Measure 3cm³ of Pectinase and 7cm³ of water to make (iii) Measure 5cm³ of Pectinase and 5cm³ water to make
(iv) Measure 7cm³ of Pectinase and 3cm³ water to make
(v) Measure 10cm³ of Pectinase and no water to be added to make
All of the above in different runs (five times for each run) to be squirt onto the apple in the beaker marked ‘Pectinase’. (Eye protection to be worn).
- Stir the contents of each beaker with a separate glass rod
- Incubate the beakers for 15-20mins in the water bath. Label two measuring cylinders ‘Pectinase’ and ‘control’ and place in the top of each filter funnel fitted with a coffee filter paper
- Pour the contents of the beakers into the filter funnels at the top of the appropriate measuring cylinders, and start the stop clock. Measure and record the volume of juice in each cylinder every minute, for 20 minutes.
- Plot graph paper for each averaged experimental run and the control run (both on the same graph).
Hypothesis:
I think that the more the concentration of pectinase, the more the juice produces, as there would be more enzymes for the break down of substrate, meaning the reaction will be taking place faster. Below is a diagram of a graph that I would expect to produce from my results:
Results
Below is the table of results obtained in experiment one (preliminary)
Below is the table of results of the processed data from the second experiment (actual experiment)
Below is the table of results of processed data from experiment two, showing only average values.
Evaluation
In this investigation, from my preliminary experiment, several things made the experiment produce inaccurate results, thus I had to make changes to the whole investigation, to make the investigation as accurate as possible. Below is a list of things that I changed in the investigation:
- I realised that because I was chopping all my apples at once, so as to save time, after about ten minutes, they started to discolor. For the results produced from the experiment to be as accurate as possible, I thought of using freshly chopped apples for each experimental run.
- In some of the runs, apples seemed to be absorbing some water, so to avoid this, I decided to use an electric blender to make the apple finer, so that they absorbed as little amount of water as possible.
- I did not finish my preliminary experiment because, after a while, I started not getting any results at all, so I decided to use fresh Pectinase each time because …………………………………………………………………………………………………………………………………………………………………………………………………………………………………………………………….
- I had to eliminate the use of coffee filter paper, as they were absorbing some of juice first before they started to let any juice through, so I had to replace the coffee filter papers with ordinary filter paper. However this did not solve the problem completely so I decided to saturate the filter papers with 1cm³ of water each time before I use them, so that they would not absorb any of the juice.
- I also had to change the time intervals in which I was recording the results. This was because I started getting successive drops of juice after a while, so I decided to change the time interval from every minute to every five minutes.
- I was just about getting the same amount of juice in each run every time, thus I decided to cut the number of runs from five to four.
Conclusion
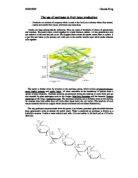
Referring to the concentration-volume graph, we can see that the graph increases as the concentration increases, but because Pectinase works at an optimum concentration of 4moldm ³, the graph is very steep between 2moldm ³ and 4moldm ³.
As the enzyme concentration increases the rate of the reaction increases linearly, because there are more enzyme molecules available to catalyse the reaction. At very high enzyme concentration the substrate concentration may become rate-limiting, so the rate stops increasing. Normally enzymes are present in cells in rather low concentrations, and thus my hypothesis was correct