For every litre of oxygen consumed, the subject’s muscles use 20kJ of energy. The total amount of oxygen consumed in a minute is the VO2 max multiplied by the body mass of the subject. This gives us the total oxygen intake of the subject in ml per minute (mlO2 min-1), since VO2 max is millilitres of oxygen per kilogram of body mass per minute. Once we have the total oxygen intake in mlO2 min-1, we multiply it by 20 (if 1 litre gives 20,000 J, then 1 millilitre will give 20 J) to get the total amount of energy used (i.e. power) in Joules per minute, (J min-1).
Power (J min-1) = VO2 max (mlO2 min-1 kg-1) x Body Mass (kg) x 20 J mlO2-1
Power (W, Js-1) = Power (J min-1) ÷ 60 s min-1
Conventionally, the power output is measured in Watts per kilogram of body mass, W kg-1 (See Table 3 on Pg 37 of the text book, Salters Horners Advanced Physics), therefore we would need to divide the total power by the subject’s mass. However the aim of the experiment is to find out the total aerobic power output. (At least that is what the Activity Sheet 26 says, under the last bullet point in the Analysis section) This means that there is no need to divide the total power output by the subject’s mass. We just leave the total power output in Watts.
(For Prepared Formulas and An Interactive VO2 max calculator, See File Formula Input Form.xls)
Interestingly, the test given on the website1 for calculating VO2 max (look for The Multi-Stage Fitness Test) differs in some ways from the one suggested in Activity Sheet 26. One of the differences is the increase of the speed is
0.5 kmh-1 every minute, not 1 kmh-1. Also, if the subject doesn’t complete a whole minute at the speed of 15.5 kmh-1, for example if the subject managed to complete 3 out of the 13 laps, then the subject would have a different (lower) VO2 max than if 10 laps were completed.
Later on, I will discuss this issue and other differences in more detail (Under the Evaluation).
The Table (Table 1)
If you refer to Table 1 (File Table 1.xls) you will see all of the information needed and all of the calculations have been done beforehand. I compiled this table using Microsoft Excel®. Below is a brief explanation of the table.
Column [1]
The speed of the subject, in kmh-1.
Column [2]
The speed of the subject given in ms-1. To convert speed from kmh-1 to ms-1, we multiply by 1,000 (converting km to m) and divide by 3600 (÷[60 x 60] is converting hours to seconds). Simplified, converting kmh-1 to ms-1 we multiply by 10/36. Therefore:
Column [2] = Column [1] x 10/36
Column [3]
The time taken to complete one lap can be worked out by the below formula
Velocity (ms-1)= Distance (m) ÷ Time (s), if we re-arrange the formula to make time the subject we get:
Time (s) = Distance (m) ÷ Velocity (ms-1).
The distance is of one lap is 20 m and the velocity has been calculated in Column [2]. Column [3] is just:
Column [3] = 20m ÷ Column [2].
Column [4]
This is the number of laps made in one minute (60 seconds). If I know that it takes 8.47 s to run one lap, I can calculate the total number of laps made in 60 seconds be dividing 60 seconds by the time taken to run one lap. So:
№ of Laps in 60 seconds = 60 seconds ÷ Time Taken to Run One Lap
Column [4] = 60 s ÷ Column [3]
Column [5]
This is just Column [4] rounded up or down to give us an integer number of laps. It means I don’t have to deal with 7.08 laps and suchlike.
Column [6]
This is the time taken to run the integer number of laps. We calculate this by multiplying the time taken to run one lap (Column [3]) by the integer number of laps (Column [5]).
Time to Run Integer № of Laps = Time to Run One Lap x Integer № of Laps
Column [6] = Column [3] x Column [5]
Column [7]
Since we know that each lap is 20 meters and we know how many integer laps the subject will run, we can find out the total distance covered during a specific speed by multiplying 20 meters by the integer number of laps.
Total Distance Covered During a Speed = 20 m x Integer № of Laps
Column [7] = 20 m x Column [5]
Column [8]
Column [8] is the cumulative distance ran. Here, the distances are added up (accumulated) so that we know the total distance ran through the whole activity. The cumulative distance is the total of the previous distances (previous speeds) plus the distance of the current speed.
Column [9]
Column [9] is the cumulative time taken for the activity. It is in seconds and works in pretty much way as Column [8], i.e. the times of the previous runs are added to the current run to give the total cumulative time.
Column [10]
This is the cumulative time presented in a more familiar and user friendly format, the minute : second style. This is just here to give a sense of how long 840 seconds are.
The Tape (or The Slideshow)
In order to make the subject run at the times listed on the Table, I will need to prepare a tape or some sort of timing device.
After attempting to make a tape and failing miserably, I decided to use Microsoft PowerPoint® instead (making the tape proved to be a long winded, boring and fruitless exercise), because, with PowerPoint, I can set time intervals between slide transitions and add sounds on every slide transition, making it a visual as well as an aural aid and I can have a lot more fun making it! (i.e. I can have lots of “interesting” and slightly odd sounds on the slide show)
I also realised that it would be more helpful (to the subject) if I had a sound in the middle of each lap and to have a marker on the middle of the lap (10 meters). In case the subject is going too slowly and doesn’t reach the middle marker when the middle bleep sounds, they can speed up to reach the end of the lap in time.
However there is a slight disadvantage with using PowerPoint because the transition periods can only be set to 0.1 of a second (1 d.p.) and the lap times are given to 0.01 of a second (2 d.p.) and some of the half laps are to 0.001 of a second (3 d.p.). Therefore I have had to alter the timing of the transitions slightly so that there isn’t a cumulative error. For example, during the first speed (8.5 kmh-1), it takes 4.235 seconds to complete half a lap, but I can only have 4.2 and 4.3 as time intervals in PowerPoint, therefore I had to find a pattern that consisted of 4.2 and 4.3 time intervals to fit the 4.235 time interval as well as possible.
This technique took quite some time, however, using Excel helped greatly. With Excel, I could input different patterns (using 4.2 and 4.3 seconds) and view the sum automatically. If it wasn’t right (i.e. if the total time wasn’t near the time in Column [6] in Table 1), I simply changed the pattern until I got the closest time.
Also I decided that there wasn’t a need to go beyond 13.5 kmh-1 because when we did a warm up to the test (a kind of preliminary), none of the subjects managed to run over a thousand meters. In order for any of the subjects to complete the 13.5 kmh-1 speed, they would need to run at least 1100 meters, therefore there was no point in extending the presentation beyond that speed.
(See Files Timing.xls for the pattern generating, and Timing Presentation.ppt, listen out for a treat during the last few slides)
The Safety (Issues)
It is always important to consider safety in any situation, and it is especially important in this type of activity where there is a fairly high risk of an accident and or an injury occurring. Below is a set of guidelines that the subject and others present during the activity should follow.
The subject should begin with a five to ten minute warm-up period, before the test is started. It should consist of stretches and short runs where the subject should rapidly accelerate and then decelerate. This helps the subject to run better in the test and also helps avoiding any muscle cramps during the test.
In the (relatively) unlikely event of the subject falling, or hurting him/herself in any other way, the subject should stop running immediately. Also if the subject feels any pain or dizziness, they should stop. The subject should not continue with the test, even if they seem or appear to have recovered.
The Results
The results are in the Result Sheet (unsurprisingly). The results were gathered from the experiment, which was conducted with ten subjects, including myself. They are in order of VO2 max.
(The Results Table can be found in Results.xls)
The Evaluation
After completing the experiment, I worked out the aerobic power of the subjects very easily, with the help of Excel. I personally found the experiment enjoyable and it my got the heart pumping! (A somewhat rarity in physics, consider electricity… ok, maybe pacemakers, and the way they electrically shock people who have had heart attacks with two funny looking handle things, not much else though).
However, there were many problems I encountered while conducting the experiment. To begin with, we couldn’t find a 20 meter track anywhere in our school, considering the fact that there had to be a socket close by since my timing mechanism uses a computer (there are three sports halls in the school, but they were all busy). Therefore, I had to settle for a smaller 10 meter track. The fact that I had midpoint bleeps in the timing mechanism meant that each bleep (midpoint and full-length bleeps) was a signal for the subjects to reach the end of the 10 meter track. This meant the timing was not affected, however the experiment could have been affected greatly. (See the Miscellaneous Calculations section)
Secondly, in the Activity Sheet, it says, “For every litre of oxygen consumed, 20kJ of energy are transferred to the subject’s muscles”. However it fails to mention whether or not some of that energy is lost as heat and other ways of energy loss (e.g. fiction from the ground, the energy needed to stop at the end of every lap and even the energy needed to move the muscles themselves, i.e. contracting and relaxing of muscles). There are no suggestions or hints on how much of the energy is used to propel the subject. Although this can be calculated in the kinetic energy equation, EK = 1/2mv2, and the power equation P = ∆E/∆t . However, I suspect that these energy fluctuations are taken into account via the VO2 max formula.
But even the formula itself isn’t very accurate in my opinion. As I mentioned earlier, if two subjects managed to sustain the same MAS (Maximum Aerobic Speed) but one of the subjects ran more laps, then logically that subject has a higher VO2 max. This logicality is not, in any way, included in the formula. On the website (See Note 1 of Reference) the tables show that if one of the subjects ran more laps during the same speed, that subject would have a higher VO2 max that if he/she managed to run a smaller number of laps. Therefore, I do not believe that the formula for calculating VO2 max on the Activity Sheet 26 gives a correct quantitative value of the subject’s VO2 max. Although the experiment has shown that some of the subjects are fitter that others (i.e. the experiment is correct qualitatively), it did not produce reliable figures with regard to the VO2 max of the subject.
On the first of the Activity Sheets, Figure A26.2 shows a line graph of VO2 max for boys and girls at different ages. According to the graph, 16-year-old boys should have a VO2 max of 52-53 mlO2 min-1 kg-1. Ops! (My VO2 max is nowhere near that, or at least the formula tells me that it is nowhere near that). It shows that I am not as healthy as I should be, considering that my mass is 85 kg! Unlike Robert, who is a very healthy person and managed to run at a high enough speed to get a high VO2 max. (Although I should stress again my doubt about the numbers given by the formula)
The Miscellaneous Calculations
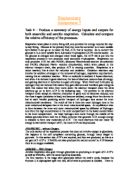
A velocity-time curve of the subject’s motion.
Note the area under both of the curves should be equal since the same distance, 10 meters, is travelled. The distance is the speed multiplied by the time i.e. the area under the graph.
A
As mentioned earlier, the energy needed to propel a subject can be calculated via the kinetic energy equation.
EK = 1/2mv2 and P = ∆E/∆t
My mass is 85 kg. If I ran one lap at 8.5 kmh-1 (which is 2.36 ms-1, Refer to Table 1), the energy needed is:
EK = 1/2mv2 so, EK = 1/2 x 85kg x (2.36ms-1)2
EK = 236.7 J
If the above amount of energy were delivered by my muscles in one lap (10 meters, since that was the length each subject had to run) at 8.5 kmh-1, it would have taken 8.47/2 seconds (only half a lap, 10 meters). So:
P = ∆E/∆t P = 236.7/4.235 P = 55.9 Js-1, W
However, if I ran 20 meters, then the power is:
P = 236.7/8.47 P = 27.9 Js-1, W
The amount of energy accumulated while running a lap is then dissipated towards the end (of each lap) as the subject must come to rest i.e. the velocity is zero. Notice also that because the subject has to accelerate at the beginning of every lap, some extra energy is needed for that acceleration. The subject must accelerate every 10 meters because he/she has stop and then run in the opposite direction.
As the lap distance decreases, the power transfer increases. This shortage (of lap distance) will also cause the subject to accelerate and decelerate more often. Therefore, the smaller the lap distance, the larger the error could be (due to the fact that some of the energy is used up in accelerating). Using a 10 meter track instead of a 20 meter track could have affected the results because this meant more energy used in accelerating. It is therefore, justifiable to say that had the track been longer (i.e. 20 meters), myself and all of the other subjects could have been able to sustain a higher speed instead of the one that was achieved.