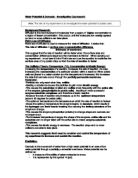
In contrast to this if the solution has a low salt content and a higher proportion of water; the cell will uptake and absorb more water using osmosis, across the water potential gradient and into the potato cell. This will result in the potato cell increasing mass and becoming turgid due to the water potential becoming less negative. This results in the cell wall of the potato cell beginning to prevent the vacuole from expanding. If the solution shares the same water potential as the cell then there will be no change in mass because the solution is isotonic.
A Diagram To Represent Hypertonic, Hypotonic & Isotonic solutions
This reliable primary and secondary research leads me to predict that the greatest amount of osmosis in a potato cell will occur between 0.20 M and 0.40 M of salt solution therefore the water potential of the cells will be between -860 kPa and -1120 kPa.
Variable:
The variable for the investigation will be the concentration of salt solution (NaCl). The concentration of salt solution will vary from 0.0 mol (distilled water) to 0.5 mol (salt solution). Furthermore the concentrations will rise by 0.1 mol each time. This means I will be testing 0.0, 0.1, 0.2, 0.3, 0.4 & 0.5 molars of salt solution. This is the only thing I will vary on behalf of my experiment.
Constants:
I will keep the following features in my experiment the same.
Considerations
Data Range – I have decided to use six different salt concentrations for my experiment. I think that doing this will supply a wide range of results which will enable me to establish pattern within the results.
Repeating Test – To ensure my results are accurate, I intend on repeating my experiment which will give me to sets of results. I will be able to compare these results with my original results. Repeating my experiment will help locate any anomalies in my original results.
Controls – Controls are used to ensure the successful outcome of an experiment is not affected. I am going to control various factors which could potential effect my results. Some of many factors include temperature, light, amount of salt solution used and the duration of experiment.
Risk Assessment
Apparatus
Method
-
Locate, clear and prepare a safe, clean environment to carry out the experiment. This area will be used for the duration of the experiment.
-
Put on a pair of goggles to avoid damage to eye; this is a health and safety regulation necessary before carrying out any scientific experiment.
-
Gather 6 x 250ml measuring beakers. Label each of these using a non-permanent pen with the corresponding concentration of salt solution (0.0 – 0.5 molar); this helps to organise the experiment and avoid confusion at a later stage.
-
Using 225ml of water and 75ml of salt solution (aq); make up each of the six concentrations of salt solution (a mixture of Salt (NaCl) and Water (H20)) by mixing each of the liquids together in the specific measuring beaker for the specific concentration. The concentration conversions for each of the six measuring beakers are shown below.
-
Make sure the correct amount of H20 and NaCl is used for each of the six different concentrations. Abnormal results will occur if the concentrations needed for the experiment are wrong.
-
Each of the six measuring beakers should contain 50ml of concentrated salt solution; use the scale on the measuring beaker to make sure that each of the beakers contain only 50ml of salt solution.
-
Using a pipette, extract 30ml from each of the six salt concentrations and put this into each of the six boiling tubes. Label the six different concentrations on each of the six boiling tubes using a non-permanent pen as this will help keep track of which concentration is in each beaker.
-
Place each of the boiling tubes in a boiling tube holder in corresponding order (0.0 – 0.5 molar); this helps to avoid confusion at a later stage in the experiment.
-
Using a 6mm cork borer and a large potato, cut 12 cylinders of similar size. Ensure that the direction and angle (preferably vertically through the largest face) of cut is the same for each of the 12 potato cylinders; this makes sure the arrangement of the cells are the same since the surface area will be affected.
-
Using a white tile as a foundation, collect a scalpel and cut each of the 12 potato cylinders so that they are 32mm in length; simultaneously check the length of each cylinder using a calliper measuring device to avoid error from the human eye.
-
Use a paper towel to remove excess surface moisture from each of the cylinders before finding the mass of them; do this by gently dabbing the external area of each potato cylinder. This eliminates any biased readings prior to the experiment.
-
Again use a white tile and collect a scalpel to divide each potato cylinder into four pieces, each 8mm in length. By doing this, the surface area is increased which will make our test more reliable. Repeat this for each of the 12 potato cylinders.
-
Collect 12 pins and place each of the 12 potato cylinders (divided into 4) onto a pin. Ensure each of the 4 pieces are evenly spread along the pin. Doing this makes it easier to locate each potato cylinder at the end of the experiment.
-
Use a balance to establish the mass of each of the potato cylinders. Use the results table to record the starting mass of each potato cylinder. Ensure a 2 place balance is used to maintain accuracy. A 2 point balance helps to keep the test precise and accurate.
-
Place 2 pinned potato cylinders in each of the 6 boiling tubes. Ensure the two potato cylinders are not touching each other and that they are placed in the solution at the same time. This can be achieved by asking other members of the group to help.
-
Start the stopwatch as soon as the 12 potato cylinders enter each of the solutions.
-
Place boiling tube lids over each of the six boiling tubes. This is to avoid the possibility of evaporation.
-
Leave the boiling tubes in the same environment for 20 hours. The temperature of the environment must be constant and not too high. If the potato cells are left in extreme temperatures, they will become denatured and osmosis will not occur.
-
After the period of 20 hours. Remove each of the 12 potato cylinders at the same time. Use a paper towel to remove excess solution from the surface of each cylinder.
-
Measure the new mass of each potato cylinder and record the results in the results table using a balance. Again make sure these results are recorded using a 2 point balance.
- Safely clean up the area of work and clean all the appropriate apparatus used in the experiment; this is important for future experiments since equipment must be in good condition for an experiment to be succesful.
How will I collect the data I need?
I will collect my data in the form of a well organised table. A results table shows the data I need to collect throughout the experiment. An example of the type of results table I will use is shown below:
Results Table
This table will help me to successfully collect the data I need. The table shows that:
-
I am using a range of salt solution concentrations (0.0 – 0.5) to investigate the water potential (Ψ) of potato cells.
- I am repeating the experiment to avoid any anomalies.
- I am measuring the mass (g) of each potato chip before and after the experiment
The aim of the my experiment is to investigate the water potential of potato cells at different salt concentrations. Obviously it is very difficult to make each chip exactly the same mass (g). The difference between the mass of the chip prior to the experiment and post experiment isn’t accurate enough to make a conclusion. The table below illustrates the problems with mass.
The table shows that each potato started of at different masses (g) and finished at different masses (g). However the total mass change (g) is the same for both potatoes. This figure does not take into account the proportion/percentage of actually how much each potato has increased by.
As the table suggests finding the total mass change (g) only shows how much that particular potato has increased or decreased by. In contrast, the total mass does not show the percentage change when compared to another potato of different mass. Obviously it will be very difficult to make each potato cylinder exactly the same length & mass so I will have to use the total mass change (g) and the starting mass (g) (working formula showed below) to calculate the percentage change (%).
Percentage Change In Mass = Change in mass
Initial mass x 100
What will I do with my collected data?
I will use my data in various ways to help generate conclusions. First of all I will plot my data within a graph to establish any hidden patterns within the data itself. An example of the type of graph I will use to plot my results is shown below.
Once my results are plotted on this graph. I will be able to establish how the water potential of a potato cell changes in mass at different concentrations of salt solution.
I will use a graph similar to the one above. This graph will help me to determine water potential (Ψ)of potato cells and draw conclusions. I will use my results to plot a graph similar to the one above. I am to establish where the line of best intercepts the x-axis (example shown above) since this will signify the where the concentration solution is isotonic (neither increased or decreased in mass (g)).