Transport enzymes: are enzymes which move substances from one region to another.
Such enzymes are usually found on the membrane of cells or organelles. The cell membrane controls the entry and exit of substances from the cell with the aid of these enzymes. It is made up of a phospholipid bilayer which contains proteins that span the membrane. These proteins transport large molecules such as amino acids and glucose, and ions such as sodium ions in and out of the cell via the cell membrane.
These membrane-bound proteins transport substances across via facilitated diffusion and active transport.
Facilitated diffusion is simple diffusions that occur through specific membrane-bound proteins. So it is the net movement of particles through a carrier protein, from a region of relatively high concentration to a region of relatively lower concentration until evenly spread. Like diffusion, it is a passive process that does not require an input of energy. Facilitated diffusion occurs along the concentration gradient. The carrier’s proteins have a specific shape; therefore they can transport only specific molecules across. The movement of glucose by facilitated diffusion is shown below.
The glucose molecules move randomly in solution, which provide it with the energy and driving force. They diffuse into a carrier protein molecule causing it to change shape. Thee outcome is that the particles are released on the other side of the membrane. This is facilitated diffusion. The direction of the net movement is determined by the concentration gradient.
The rate of facilitated diffusion i.e. the net movement of a certain molecule in a given time depends on:
-
The no. of specific carrier proteins available to transport the molecule – so if there are many specific carrier proteins present on the cell membrane to transport molecule X, then the probability of molecule X diffusing into the carrier protein is greatly increased therefore more molecules of X are transported across the membrane via facilitated diffusion.
Rate of facilitated diffusion is also dependant on factors that affect simple diffusion. These include:
-
Concentration gradient – This is the difference in the concentration between 2 areas i.e. the difference between the inside and outside of the membrane. If there is a high concentration gradient, particles will diffuse much faster, across the transmembrane channels to reduce the gradient.
-
Distance between the areas – The longer the distance the molecules need to travel in order to equate the concentration between 2 areas, the slower will be the rate of diffusion. This is because it will take molecules longer to cover the large distance and diffuse across.
-
Sizes of the diffusing molecules – small molecules tend to move faster than larger molecules, therefore diffuse faster.
-
Temperature – when the temperature is high, the particles have more kinetic energy. Therefore they move much faster hence, the rate of diffusion is quicker. If a membrane is involved, the particles collide with the membrane more often thus being transported across it by carrier proteins much faster, causing an increase in the rate of diffusion.
All the factors outlined above affect the rate of facilitated diffusion. These factors need to be considered in my experiment, as saccharomyces cerevisiae cells absorb the substrates it requires by the process of facilitated diffusion.
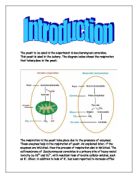
Respiratory enzymes:
Coenzyme A: enzymes involved in the link reaction and the Krebs cycle. It is important because it combines with acetyl group made from pyruvate carrying it into the Krebs cycle, in the form of AcetylCoA.
Dehydrogenase enzymes: These are vital enzymes which remove hydrogen atoms from many molecules such as citrate and oxoglutarate in Krebs cycle oxidising them. It transfers the removed hydrogen atoms to other molecules causing them to become reduced. NADH dehydrogenase is a specific enzyme involved in the electron transport chain. It removes hydrogen atoms from reduced NAD made throughout respiration, oxidising the NAD. The NAD+ is recycled while the hydrogen atoms lost dissociate to form H+ and electrons. The H+ ions are pumped out to the intermembranal space of the mitochondria while the electrons are passed through carrier proteins down the electron transport chain.
Cytochrome oxidase: This is the terminal electron carrier protein. It catalyses the combination of 2 electrons, 2 hydrogen ions, both originally from reduced NAD, with a molecule of oxygen, forming water. This is a waste product of respiration.
These are the main enzymes involved in respiration.
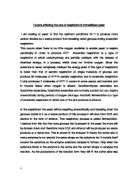
Now that I have looked at the different types of enzymes, it is essential that I am aware of the factors which affect the activity of enzymes.
Enzymes activity is affected by:
Temperature
An increase in temperature, usually results in an increase in the rate of a reactions meaning the enzyme and substrates come together more often. This is because at high temperatures, molecules possess more kinetic energy thus moving around much faster. The chances of enzymes and substrates bumping into each other hence colliding successfully is greatly increased, since they have enough energy. Therefore, the rate of the enzyme-controlled reaction proceeds at a much faster rate.
However, as temperature increases, the atoms within the enzyme molecule will start to vibrate. The vibration increases as does temperature. The fast vibrations cause weak hydrogen bonds that maintain the 3D tertiary structure of the enzyme, to break causing the shape of the enzyme to be distorted. As a result the shape of the active site is also disrupted. At first, the substrate fits less easily but soon, it can no longer fit snugly with the substrate molecule. Consequently it has no effect on substrate molecules and is said to be denatured. Once broken, the bonds cannot reform regardless of a decrease in temperature. When all the enzymes have denatured, the reaction stops. The graph shows that as temperature increase from X˚ to Y˚, so does the rate of the reaction. At Y˚, there is a peak where the rate of reaction is proceeding at the fastest rate. This temperature Y˚ is called the optimum temperature. It is the temperature at which the enzyme works best at. After Y˚, the rate of reaction falls grinding to a halt. This is because above Y˚, the enzyme has denatured and therefore can no longer catalyse any reaction or work on any substrates.
The optimum temperature differs from enzyme to enzyme. Some work efficiently at high temperatures while others at low. “Saccharomyces cerevisiae are active in a very broad temperature range - from 0 to 50° C, with an optimum temperature range of 20° to 30° C.” (www.fao.org). For my experiment, I have therefore decided to use a temperature of 30° C.
pH – is a measure of the hydrogen ion concentration
Each enzyme has an optimum pH i.e. the pH it works best at. At this pH, the rate of reaction proceeds at its fastest, so more products are formed in a given time. Any change to the pH can affect the structure of the enzyme molecule. This is because H+ in an acid or the OH- in the alkali disrupt the hydrogen and ionic bonds between the –NH2 and –COOH. These bonds are holding the enzyme in shape and if disrupted, the tertiary structure hence the shape of the active site will be altered in such a way that the enzyme will not function. It will have denatured and so will have lost its ability to bind and act on a substrate. The rate of reaction will slow down coming to a stop.
Most enzymes act over a narrow pH range. Saccharomyces cerevisiae works at an optimum pH of 6.5. But, in the process of respiration, CO2 is produced. This product will cause the saccharomyces cerevisiae solution to become acidic altering the pH. Thus it needs to be controlled. I have therefore decided to use a buffer solution. Buffer solutions can be used to prevent fluctuations in pH because they can resist changes to pH.
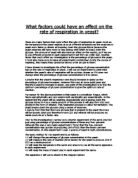
Enzyme concentration – It is obvious that if you increase the no. of enzyme molecules in a reaction, there will be more empty active sites available for the substrate to bind with. More enzyme- substrate complexes shall form resulting in an increased rate of reaction. So, as you increase the no. of enzymes, the rate of reaction increases. However, this is only true to a certain extent. Soon or later, the no. of substrates available to bind with the enzymes are simply too less. So even though, there are enough enzymes, there are too few substrates to act upon. Some enzymes will be free. At this point the substrates are considered the limiting factor and the rate of reactions begins to slow down gradually coming to stop when all substrates have been used up. Adding more enzymes will have no effect.
For my experiment, I am testing the effect of different substrates on the rate of respiration and thus I shall ensure that the concentration of substrates are not the limiting factor, by keeping them in excess otherwise my results will not be considered to be reliable.
Substrate concentration - This also is a factor which affects the enzymes activity. Generally, as you increase the concentration of substrates, the rate of reaction increases. This is because, again there are more molecules in a given volume thus collisions between enzymes and substrates are more likely. More enzyme-substrate complexes form resulting in an increased rate of reaction. However after the ‘saturation’ point, if you continue to increase the concentration of substrates, the rate of reaction will slow down and then become constant. This is because there will be too many substrates available for the enzyme to work on. The enzyme will be working as fast as it possibly can but even still, the no. of substrates present will be too many for the enzymes to cope with. So any further increase will have no affect whatsoever on the rate of the reaction because products will be formed at the constant rate by the enzymes. The graph will begin to level off and enzymes will now be considered the limiting factor.
Saprophytic Digestion
Yeast are important fungi that can respire both aerobically and anaerobically. They need organic compounds as a source of energy. Saccharomyces cerevisiae digests food externally. It feeds by secreting enzyme, which diffuse through the cell membrane and onto the food source. The enzymes hydrolyse the food source, digesting it into smaller monomers which can more easily be absorbed through the cell membrane and cell wall of saccharomyces cerevisiae, by the process of active transport and facilitated diffusion. This method of feeding is called saprophytic feeding.
The specific yeast I will be using is called Saccharomyces Cerevisiae.
PLANNING
The dependant variable in my investigation is the volume of CO2 produced. It is dependant on the substrate that I decide to use therefore the independent variable is the (type of) substrate that I decide to use.
All other variables are controlled variable and it is essential that they are kept constant so that they have no effect on the reliability of my results i.e. no effect on respiration in saccharomyces cerevisiae hence the volume of CO2 produced.
Null hypothesis:
“The substrate used does not affect the volume of CO2 made in respiration by saccharomyces cerevisiae.”
Hypothesis:
“The type of substrate used does affect the volume of CO2 made in respiration by saccharomyces cerevisiae.”
Prediction:
When the substrate is added to the saccharomyces cerevisiae solution, respiration does not begin immediately. In fact, the substrate must enter the cytoplasm of the saccharomyces cerevisiae cells before it can undergo respiration. So the saccharomyces cerevisiae cells initially needs to release digestive enzymes, specifically carbohydrase to extracellularly digest the large carbohydrates such as disaccharides or polysaccharides, because these are simply too large to pass through the membrane of the saccharomyces cerevisiae cells. Monosaccharides are produced and these need to be taken in by the saccharomyces cerevisiae cells into the cytoplasm, where the initial stage of respiration, glycolysis can occur. The monosaccharides are taken up by the saccharomyces cerevisiae cells by the process of facilitated diffusion with the aid of carrier proteins. These are found in the cell membrane of the saccharomyces cerevisiae and control the entry and exit of substances, so it is vital to consider which carrier proteins are present.
After conducting my research, I predict that the substrate glucose will have the fastest rate of reaction so it will cause the yeast to produce the most CO2 in a given time. Next will be, fructose followed by maltose, then sucrose and finally, lactose, (in descending order).
I believe that yeast will produce the most CO2 in a given time, when glucose is added because it is the main respiratory substrate involved in respiration. For this reason, the cell membrane of the saccharomyces cerevisiae is designed with many carrier proteins present to facilitate in the transportation glucose across into the membrane to where they are in lower concentration. These carrier proteins are called glucose permease and use facilitated diffusion to transport glucose substrate into the cytoplasm, for respiration. Also, glucose is a monosaccharide and thus is not required to be broken down before it can be absorbed. So, when added to saccharomyces cerevisiae, it will quickly enter the cytoplasm of the saccharomyces cerevisiae cells and respiration will commence. The process will produce CO2 much quickly than any other substrate in a given time.
I predict that the substrate fructose will have the second fastest rate of respiration. This is because like glucose it is a monosaccharide and thus does not require digestive enzymes to break it down further. So why is the rate of respiration slower when fructose is used rather than glucose? The reason is that fructose, is not the main respiratory substrate in respiration like glucose. Therefore there are fewer carrier proteins present in the cell membrane of the saccharomyces cerevisiae for the transportation of fructose, in comparison to glucose. Since the no. of carrier proteins is a factor which affects the rate of facilitated diffusion, facilitated diffusion will proceed at a much slower rate. This means that it will take longer to enter the cytoplasm of the saccharomyces cerevisiae cell and hence the rate of respiration will be slower. So the volume of CO2 produced by yeast on addition of fructose in a given time will be smaller than that of glucose.
However if equal amounts of glucose and fructose were left in separate saccharomyces cerevisiae solutions until they were fully used up in respiration, we would see that they both produce the same volume of CO2. This is because fructose is an isomer of glucose hence possesses similar chemical properties. But since I am measuring the volume of CO2 made in a given time, it is highly likely that all the substrate I add, will not fully be utilized in respiration by the saccharomyces cerevisiae. So some substrate will still be present in the saccharomyces cerevisiae solution hence, the final reading of volume of CO2 may differ between the substrates glucose and fructose, depending on the length of time we allow respiration to happen in each experiment.
The substrate, Maltose will cause the saccharomyces cerevisiae solution to produce the next largest volume of CO2 per unit time is maltose. This is a disaccharide made form 2 monomers of glucose that are joined by a glycosidic bond. There are no specific carrier proteins present on the cell membrane of the saccharomyces cerevisiae for the transportation of such large molecules. So maltose is required to be broken down by the saccharomyces cerevisiae extracellularly. So when the maltose solution is added to the saccharomyces cerevisiae, the saccharomyces cerevisiae will secrete enzymes such as maltase, which travel out of the saccharomyces cerevisiae cell via the cell membrane. Maltase is an enzyme that specifically targets maltose. It catalyses the breakdown of maltose into 2 monosaccharides by the process of hydrolysis. Therefore the secreted enzyme maltase, lowers the activation energy needed for the hydrolysis reaction to occur. This means that the hydrolysis can occur at a much lower temperature. So water molecules from the solution will react with, and break the glycosidic bonds between maltose, forming a lot of glucose molecules. In fact, there will be twice as much glucose present since maltose is made up of 2 glucose molecules. As there will be more glucose present on the outside of the saccharomyces cerevisiae membrane compared to the experiment with the substrate glucose, there is a greater concentration gradient. Concentration gradient is a factor which affects facilitated diffusion too. So although, it shall take the saccharomyces cerevisiae a long amount of time to release enzymes to break down the substrate by saprophytic digestion initially, the rate of facilitated diffusion of the glucose into the saccharomyces cerevisiae, in this experiment is more rapid.Since the concentration gradient is much steeper than that of the experiment involving saccharomyces cerevisiae and the substrate glucose. So there will be more substrate present in the saccharomyces cerevisiae to undergo the respiration reaction and release CO2 per unit time. Therefore, the rate of respiration will begin to increase steadily. But since I am measuring the rate of respiration in a given time, I predict the rate of respiration i.e. the rate of CO2 production will initially be zero, so no reaction will occur since saprophytic digestion needs to happen. But once this is done, the rate would be fast. As digestion can be a lengthy process, I predict that the volume of CO2 produced by adding maltose to yeast, in a given time will be less compared to that of fructose and glucose. I am assuming that the break down of maltose will take up a lot of time and all the maltose will not have been used up by the end of the experiment. For if it had been, the volume of CO2 produced by saccharomyces cerevisiae would have surely been a lot higher than that of glucose since it is made up of more glucose molecules i.e. has a larger Mr.
The fourth substrate to cause saccharomyces cerevisiae to produce the next largest volume of CO2 per unit time i.e. the substrate to have the next fastest rate of respiration, I predict, will be sucrose. This is because, like maltose it as a disaccharide and needs to be digested before absorption. So the digestive enzyme, sucrase will be released by the saccharomyces cerevisiae. This enzyme will hydrolyse sucrose in exactly the same way that the maltase hydrolyzes maltose. The end products of hydrolysis of the sucrose will be two monosaccharides; one molecule of fructose and one of glucose and a by-product, which is water. Since the cell membrane of the saccharomyces cerevisiae I assume, has both glucose and fructose carrier proteins, the products can easily be taken in by facilitated diffusion. However, since there are more carrier proteins for glucose than fructose, the rate of facilitated diffusion of glucose will be much faster than that of fructose hence glucose will be oxidised first.
Again, there will be no respiration whilst sucrase is being released into the solution and the products of hydrolysis are being absorbed by facilitated diffusion. Once facilitated diffusion begins, respiration will also begin and the rate of CO2 production will begin to increase.
Overall, in a given time, the amount of CO2 produced will be much lower compared to the above substrates since the disaccharides needs to be digested first, which will take up some time and then be absorbed. Absorption takes longer with the substrate sucrose than maltose since sucrose breaks into glucose and fructose, which have few carrier proteins to transport theses substances into the cell. Since the products of the hydrolysis of the sucrose take longer to be transported into the cytoplasm of the saccharomyces cerevisiae, the saccharomyces cerevisiae respires much later in a given time.
Again, if the substrate sucrose and maltose were allowed to remain in the saccharomyces cerevisiae solution until completely used up, so be completely oxidised by the saccharomyces cerevisiae, the volume of CO2 produced would be exactly the same. The reason for this is that these two substrates are isomer of one another and so produce the same volume of CO2.
The final substrate that I am testing is lactose. This substrate is a disaccharide made from one molecule of glucose and one molecule of galactose. It also requires a digestive enzyme to hydrolyse it and break it down before it can enter the cytoplasm of the saccharomyces cerevisiae cells by facilitated diffusion. The enzyme needed for this hydrolysis, is lactase. After doing my background research, I learnt that saccharomyces cerevisiae does not contain any lactase enzymes. This means that no lactose can be broken down. If it is not broken down into smaller molecules, it cannot be transported across the cell membrane of the saccharomyces cerevisiae for respiration. Since lactose will not be taken in, there will be no respiration reactions occurring, therefore neither aerobic nor anaerobic respiration can proceed, hence no CO2 will be produced. In conclusion to this, I predict that the rate of respiration would be constant at 0cm3 per unit time.
In general, I believe that, since monosaccharides do not need to be digested before being taken up by the saccharomyces cerevisiae cells, they will cause the saccharomyces cerevisiae cells to respire at an earlier stage and hence would be allowed produce large amounts of CO2 in a given time. The rate of respiration will be faster initially, while in disaccharides, digestive enzymes need to be secreted in order to break down the disaccharide before absorption, therefore this process will take more time at the start of the test, causing respiration to commence at a much later stage in a given time. During this time, less saccharomyces cerevisiae respires; producing small volumes of CO2, thus, the overall rate of respiration in a given length of time is slower for disaccharides in comparison to monosaccharides.
To wrap up, I predict that the substrate to cause saccharomyces cerevisiae to produce the most CO2 will be:
- Glucose ( fastest rate of respiration by yeast in a given time)
- sucrose and (slowest rate of respiration by yeast in a given time)
- lactose ( no respiration when added to yeast)
…….. in my experiment
Apparatus:
- Water bath
- Clamp and stand
- Gas syringe
- Thermometer
- Rubber delivery tube
- Conical Flask
- Magnetic flea
- Bung
- Stirring rod x 2
- Electric balance
- Stop clock
- Measuring cylinder ( 25cm3)
- Pipette (15cm3)
- Beaker ( 250cm3, 20cm3)
SUBSTRATE CONCENTRATION
Since the concentration of the substrate is a factor which affects enzyme activity, I have decided to control it. This is because the variable I am testing is not the effect of substrate concentration but the effect of different types of substrate on the rate of respiration in saccharomyces cerevisiae.
Like the saccharomyces cerevisiae solution, I have chosen to use 15cm3 of buffer solution for each experiment. This is so that the two volumes used are the same, reducing the chances of me getting confused and making any errors. If the volume of distilled water differed to that of the saccharomyces cerevisiae solution, I am more likely to forget or even mix the two up. So I think that 15cm3 of both the saccharomyces cerevisiae and substrate solution is a suitable volume that will both fit into the conical flask, when added together. Also, 15cm3 of buffer solution is a sufficient amount to dissolve quite a lot of powdered substrate, so forming the substrate solution by addition of the solid substrate should not be an issue for me, at this volume.
I have decided to keep the concentration of all substrates constant at 1M. This is because it is a suitable concentration relative to the volume of buffer solution I wish to use. When calculated, it should also provide me with appropriate masses of the substrate to weigh, i.e. not too high such as 100g, as this will not dissolve in the 15cm3 volume and not too low such as 0.5g, as this will be too difficult to weigh and simply too less. If such a small mass of substrate is used, the no. of substrate in relation to the no. of enzymes will be too few causing the substrate concentration to be the limiting factor. So a 1M substrate solution is a workable and practical concentration for my experiment.
CALCULATIONS
The two formulas below is what I shall use to calculate the mass of each substrate I am required to weigh to ensure that when I dissolve it in 15cm3, the concentration is constant at 1M
Moles = Molarity x Volume Mass = Moles x Mr
1000
Glucose – C6H12O6
Mr of glucose = 180
Moles of glucose = 1M x 15cm3 = 0.015 moles
1000
Mass = 0.015 x 180 = 2.7g
Fructose– C6H12O6
Mr of Fructose is also 180 as it is an isomer of glucose; therefore the mass of fructose to weigh is also 2.7g.
Maltose – C12H22O11
This is a disaccharide that is made up of two monosaccharides that are joined together by a glycosidic bond. During the formation of this disaccharide in a condensation reaction, 1 molecule of water (Mr = 18) is lost therefore the disaccharide maltose has an Mr of 180 + 180 (since 2 glucose molecules) = 360.
360– 18( Mr of water) = 342
Mr of maltose = 342
Moles of maltose = 1M x 15cm3 = 0.015 moles
1000
Mass = 0.015 x 342 = 5.13g
Sucrose and Lactose - C12H22O11
Sucrose is made of 1 molecule of glucose and 1 molecule of fructose while lactose is made form 1 molecule of glucose and 1 galactose. These both are also disaccharides made from monosaccharides that have the molecular formula C12H22O11. Therefore the Mr of both sucrose and lactose is also 342.
So the calculation of the amount of sucrose and lactose to weigh is the same as that of maltose shown above.
So in general, the mass of disaccharide needed for each experiment is twice the amount monosaccharide, since it is made up of two monosaccharides.
Below is a table that clearly states how much of each substrate is needed to be weighed per experiment. The stated amount should be mixed to 15cm3 buffer solution.
I will refer back to this table during my method/experiment.
Method:
Set up the experiment as shown:
- Fill the water bath three quarters of the way with water and place a test tube holder inside it, thereafter place a test tube in the holder in preparation of the experiment.
- Using a clamp, securely attach the gas syringe to the stand by turning the screw knob and tightening the clamp. Ensure that the gas syringe is closed so that it has no air inside it.
- Attach one end of the delivery tube to the mouth of the syringe and the other end, to a bung/stopper which will fit securely onto the top of the boiling tube.
- Set the stop clock to zero, then double check to ensure that it works. After this make use you set it to zero again ready for the experiment.
I decided that I will carry out 3 experiments of each substrate at the same time so for example, I will do 3 experiments with the substrate glucose at a time. However, I must leave a 1 minute interval between the start of each of the glucose experiments otherwise after 5 minutes, I would be expected to take readings form all 3 syringes at the same time, which is not possible. So, starting one experiment 1 minute after the other gives me enough time to accurately record the reading on the gas syringe onto my results table.
Also due to time constraints, it is highly likely that I will not do all my experiments on one day so preparing a bulk solution for all the experiments is not practical since the saccharomyces cerevisiae cells will multiply. This will mean that the concentration of saccharomyces cerevisiae will increase. This will make the test unreliable since concentration of saccharomyces cerevisiae is a factor that needs to be controlled. So in reality, I shall estimate the no. of experiments that I think I should be able to carry out on the day. According to the estimate, I will prepare the reasonable amount of saccharomyces cerevisiae solution and substrate solution.
Controlled variables:
All the variables explained in the table below must be kept constant. This is because I am not testing the effect of these variables on the rate of respiration but the effect of different substrates on the rate of respiration. So, throughout this entire investigation, I shall try my best to make sure that all variables except the independent variable that we are testing are kept constant. So the only factor that should be changed is the substrate, as this is the variable we are testing the effect of.
CONTROLLED EXPERIMENTS
I have decided to carry out some controlled experiments. These shall prove that the factor I am testing, the substrate is what is actually causing saccharomyces cerevisiae to respire and no other external factor such as temperature, pH apparatus etc.
I will have 6 controlled experiments, one for each of the 5 substrates and 1 with just saccharomyces cerevisiae.
I will carry out the method as normal but instead of adding substrate solution to the saccharomyces cerevisiae, I will add 15cm3 of distilled water. I will observe that no CO2 is produced because no respiration is taking place. This shows that there is no factor besides the substrate that causes the saccharomyces cerevisiae to respire. His is the controlled experiment for saccharomyces cerevisiae.
I shall do the same for all 5 substrates. To each of the 15cm3 substrate solution, I will not add any saccharomyces cerevisiae and see whether any CO2 is made. The fact that no CO2 will be made implies that for respiration to take place, a substrate needs to be present to undergo the oxidation reactions involved in respiration.
DATA COLLECTION
I have constructed a simple results table on the following page, which I intend to use to record my results as I carry out my experiments.
As you can see, I have decided to do repeat to ensure that my results are reliable. Such a huge number of replicates will enable me to make strongly reliable conclusion at the end, as I will have a sufficient amount of data to support my conclusion.
Once I have obtained by results, I intend to calculate the average volume of CO2 produced by each substrate for the 15 tests at the time intervals I have chosen. I will record my average on my results table too.
Next, I will then plot line graphs, showing how the average volume of CO2 produced by each substrate on average, changed with time. The axis for the line graph is illustrated below.
Then, I will closely analyse each line graph, looking for any trends or patterns. I shall make comparisons too, such as, how the total volume of CO2 produced at the end of each experiment differs for each substrate.
Anomalous results are quite inevitable and I will look out for any anomalous results attempting to explain their existence. I will pay particular attention to the gradient of the lines on the graphs. The gradient will be calculated using the following formula:
Change in the volume of CO2 produced (cm3)
Change in time (mins)
The gradient i.e. the change in the volume of CO2 produced over time is effectively the rate of respiration. So the values of the gradient, that I obtain from this formula is a measure of the rate of respiration. I will look carefully at the rate of respiration of each substrate during certain times, so after 5 mins, 10 mins etc. and see how the rate has changed as the reaction has proceeded. I will then compare the rate of respiration between the substrates that I have used.
Since line graphs are not sufficient enough to make a firm conclusion from, I intend to use a statistical method of analysis. I have decided to use a t-test. This is used to test the difference between 2 sets of data, in this case, to find out if the difference between the mean volume of CO2 produced by both substrates is significant enough or not.
HOW TO CARRY OUT A T-TEST
Firstly, I will draw tally chart, where I shall group the dependant variable and calculate the frequency for each group. An e.g. is shown below. I will ensure that the class intervals for the dependant variable, (volume of CO2 produced) are always equal.
I shall then use the frequencies to draw histograms. On each histogram, I intend to compare 2 sets of data so compare the volume of CO2 made by 2 substrates. Therefore I will draw the frequency histogram for the 2 using the same axis, for both sets of data. In total I should have 10 frequency histograms:
- Glucose with Fructose
- Glucose with Maltose
- Glucose with Sucrose
- Glucose with Lactose
- Fructose with Maltose
- Fructose with Sucrose
- Fructose with Lactose
- Maltose with Sucrose
- Maltose with Lactose
- Sucrose with Lactose
Once this is done, I will observe the graphs for any overlaps as shown below.
If the graphs do not overlap, then I can confidently say that out of the 2 substrates, substrate Y, produces the most CO2 than substrate X over a period of time, thus respires more. However of there is an overlap, I will first look at the size of the overlap.
If there is a little overlap, I can assume that there is high chance of there being a significant difference between the volume of CO2 made by the 2 substrates. On the other hand, if there is a lot of overlap, I can assume that there is no significant difference in the volume of CO2 produced by the 2 substrates and that any differences are simply due to chance. So as the amount of overlap between the histograms increases, the level of certainty of there being a significant difference are due to chance, increases too.
For all those graphs that overlap, I will do a t-test to test how certain I am, whether the difference between the mean values for the data is significant or simply due to chance.
To calculate the t-value, the formula is:
I will have obtained a t-test value from the formula. It will then be compared to the value of tin a table.
In order to compare our value we need to first choose a probability that we are going to use to calculate the number of degrees of freedom. A probability of 5 % is commonly used, and I believe is sufficient.
Degrees of freedom for the test is simply “the sum of the number of measurements in both groups – 2”. For both substrates, I have 15 readings, our degree of freedom is (15+15) = 30 – 2 =28.
Finally, I will compare my t value to that found on the t table for 28 degrees of freedom and a probability of 0.05. If my t value is greater than that on the table, the null hypothesis is rejected and I can concluded that there is a significant difference in the volume of CO2 made by the two substrates, hence the rate of respiration. But if my t value is less than that on the table, the null hypothesis is accepted and I conclude that there are null differences in the volume of CO2 produced by the two substrates and so substrates do not affect the rate of respiration. Any differences are due to chance or instrumental inaccuracies.