Pliminary experiment- Prior to the planning of this experiment, an experiment was conducted. This experiment is very similar to the one done previously, in the sense that absorbance and glucose concentration was also being tested for. I tried to put me solution in water baths to find a ideal temperature and time. I found that an ideal temperature would be 100°C as this produced the best results and a ideal was 2mins 30seconds therefore I decided to use these for this experiment. I found that when the light over the colorimeter was blocked it increased the absorbance reading. Therefore in order to avoid this I tried not to block any of the light on colorimeter by shadowing it. Also I insured that the colorimeter was placed in the same position in the lab and that all experiments were done in relatively same period of time, so that the colorimeter would receive the same amount of light from surroundings.
The dependant variable in this experiment will be the reading on the colorimeter of the different absorbance readings. This is what is to be controlled, as we shall be given 4% of glucose concentration measured prior to starting the experiment.
The independent variable in this experiment is type of fruit, orange, grapefruit and lemon. The three fruits cannot be considered as being independent variables as they have their own concentration of glucose and these concentrations cannot be altered, so there is no control over it. Whereas the glucose concentrations can be altered by dilution.
The colorimeter was chosen rather than using the Buchner flask to remove the percipitate. The Buchner flask is very unreliable as it involves using a filter paper (process known as vacuum filtration) which allows some of the solute through which would give the wrong results. It is a long procedure making it time consuming. I chose a graduated pipette, however I could have also chosen to use a syringe or a measuring cylinder. I thought this would be most suitable, as a syringe in most cases does not have measurements on it. It would be easier to use the pipette compared to a measuring cylinder, as it is quicker and more accurate.
CALCULATION
To make a 4% concentration of glucose, 4 grams of glucose would be dissolved in 100ml of water. The answers of the glucose must be expressed in mg/cm-3. It can be calculated from the following information: g/l (grams per litre) = mg/ml (milligrams per millilitre) = mg/cm3 (milligrams per centimeter) or the steps are kg g mg, with 1kg = 103g and 1 mg = 10-3 g, and 1L = 1000cm3.
I can use the above information to calculate the percentage of glucose into mg/cm-3:
4/100=0.04g 0.04X 1000= 40 mg/cm-3
- Using the chinagraph pencil, label the test tubes 1-5 near the top of the first 5 test tubes. On the remaining three, label them with lemon, grapefruit and orange.
- Using the graduated pipette, pipette 8mls of 4% glucose solution into test tube 1. This should then be labelled ‘4%’.
- Remove 4ml of the 4% glucose solution from test tube 1 and place it into test tube 2. Now add 4mls of distilled water to test tube 2. This should be done using a graduated pipette. Stir test tube 2 with a glass rod. This should now be labelled ‘2%’.
- Remove 4ml of the solution from test tube 2 and add it to test tube 3. Fill up the test tube up to 8mls using distilled water.
- Remove 4mls of the solution from test tube 3 and add it to test tube 4. Fill up the test tube up to 8mls using distilled water. This should be repeated for test tubes 5 accordingly. On test tube 5, remove 4mls of the solution and dispose of it. Insure that all the test tube appears to have the same amount of solution in them.
- Using the graduated pipette, pipette 4mls of Benedicts solution into each test tube.
- In the remaining three test tubes, squeeze out the different fruits and then using a funnel and a filter, making sure that no pulp is collected. Then measure out 4ml of each fruit juice using a graduated pipette and label the test tube.
- Place all the test tubes into the water bath which will be set at 100°C and using a stop watch time the experiment for 2 minutes and 30 seconds.
- Remove the test tubes from the water bath using tongs as the water is quiet hot and can burn if in contact with skin.
- place the test tubes in a rack and compare the colours in each tube and record the results into a table using coloured pencils. This is recording the observation colour.
- Switch on the colorimeter after plugging it in. Wait for about five minutes for the bulb to warm up.
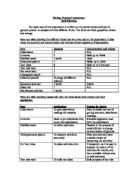
- Choose the correct filter which is required. This is chosen by the colour of the substance that is to be measured using the following table:
- Set the colorimeter to absorbance by turning the knob in the top left-hand corner of the colorimeter.
- Fill up a cuvette with distilled water up to ¾ full. Place this in the slot and set the scale to zero.
- Using the same cuvette in the same position do all the tests. Using the same cuvette decreases chances of incorrect results as other cuvettes may absorb more light or may be thicker/thinner.
- After each sample, rinse out the cuvette as this prevents the next sample being diluted more. Make sure the outside of the tube is dry before it is placed into the colorimeter.
- Take samples of each test tube one by one and place 3ml of each in to cuvettes and find their absorbance reading using the colorimeter.
- Take down the readings of absorbance in the results table.
- Draw a graph with the absorbance readings on the y-axis and the glucose concentration on the x-axis. This should be done very accurately as other results will be deduced from this graph when finding the percentage of glucose in the three fruit juices.
- Place 4ml of each of Benedicts solution into each of the fruit juices test tubes. Stir with glass rod and repeat the steps for the colorimeter.
- When the readings have been given for the fruit juices, the figures should be lined up on the y-axis and the figure should be taken from the x-axis, which would indicate the glucose concentration of these juices.
- The whole experiment should be repeated three times so that an average can be obtained. Then the average can be calculated and then recorded in a tables to give the best results. By reading the results of the fruits off the graph each time, can indicate whether the experiment is going well or not.
(http://ntri.tamuk.edu/colorimetery/complementry=colours.html)
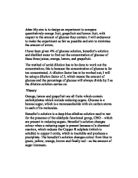
Sources of Error
A serial dilution is can be a source of error as if a mistake is made, this will be transferred in to the rest of the test tubes.
This table shows all the quantities of the different solutions used in the experiment
This shows the table that would be used when taking down the results of the three repeats.
When the average results have been calculated and been recorded, a graph can be drawn. From the graph, conclusions can be made if there are any trends or patterns. From the graph, anomalous results can be pointed out and can be discussed to why these occurred.
The dependent variable goes along the y-axis, which are the absorbance readings and the independent variable shall be along the x –axis, which is the glucose concentration measured in mg cm-3.
To make this experiment reliable, the experiment will have to be repeated at least three times, so at the end, an average can be calculated for each different concentration. This would be useful as from analysing the results, as we can see weather different results are close to each other. The same volume will have to be taken from each juice from the fruit and should all follow the same process.
As choosing the colorimeter rather than the Buchner flask will make the experiment more reliable. This is as the Buchner flask involves using a filter paper, which is not very reliable as the filter paper still lets through some of the solute, which would lead to giving the wrong results. Also when actually reading the results, care will have to be taken of how they are read e.g. the highest reading will be taken on the colorimeter because the reading may not stay still. Measuring the solutions will have to be done properly with care. If the solution volumes tend to change and not be accurate of one test tube, the rest of the test tubes will be affected too. The water bath will have to set to exactly 100°C. the tubes should only be placed in the water bath when the water has reached 100°C and it should remain that temperature throughout.
A graduated pipette is accurate for measuring small quantities such as the glucose solution. Measuring the solutions will have to be done properly with care. To gain accurate results from the colorimeter, the cuvettes will have to be wiped and cleaned properly on the sides where the light is to pass through so that the beam of light can pass through without being refracted by smears. The water bath will have to set to exactly 100°C. The tubes should only be placed in the water bath when the water has reached 100°C and it should remain that temperature throughout.
For the experiment to remain a fair test care must be taken when using the graduated pipette, it would have to be made sure that there are no air bubbles taking up space affecting the measurements. This is resolved by using the pipette correctly. The glass rod will have to be cleaned after every time it has been used to stir solutions. This is as some solution could stay on the rod and when it is used to stir the next test tube, it could affect the solutions. Whenever I put a number of test tubes in to a water bath, I will place them in a rack, then place the whole rack in the water bath and on removing, remove the whole rack. This will ensure that all the test tubes have had the same amount of time in the water bath.