Safety
Whilst the practical side of this investigation does not include any particularly dangerous apparatus or methods, there are still some safety considerations to be taken.
Eye protection will have to be worn whilst the nylon has stress and strain applied to it, as the material will be taken to breaking point, which could result in the material whipping back very quickly at this point, posing an eye damage hazard. It is also worth noting that at this point a substantial amount of weight will be dropping so arms and feet should be kept back from below the experiment and all persons in the vicinity should be on their feet to allow them to move back quickly if required.
Error Reduction
The practical side of this investigation is prone to errors through a number of factors. In order to attempt to reduce the number of errors that will affect the results of the investigation during the implementation of the practical, the following steps will be taken, in addition to the experiment being repeated three times as already mentioned above:
- Micrometer should be checked before each use to make sure it lies on the zero value when fully closed.
- Double-check all readings to be taken from the micrometer and ruler, and double-check the calculations for area on calculator.
- Nylon should not be interfered with once set-up on the clamp, in order to reduce added stress or weakening through factors not related to the intentional weights being added.
Apparatus Set-up Diagram
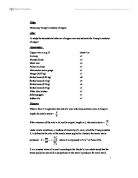
Table of Results – First Experiment
Error and Uncertainty
Area: The micrometer used to measure the diameter of the nylon had an accuracy of 0.001mm, meaning there is an uncertainty of +/- 0.001mm to this measurement. With the measurement for the diameter being 0.185mm, this had a 0.54% level of uncertainty.
Original Length: Using a 1m ruler accurate to 1mm, and therefore an uncertainty of +/- 0.001m, the original length measurement of 0.550m has a 0.18% level of uncertainty.
Extension: This was measured with the same instrument as original length, meaning an uncertainty of +/- 0.001m. As the value for each extension differ, so will the percentage uncertainty. This ranges from 9% on the first measurement, to 0.83% on the final measurement of the extension.
Table of Results – Second Experiment
Error and Uncertainty
See first experiment results for explanation.
Area: Uncertainty of +/- 0.001mm. Diameter of 0.195mm, so uncertainty percentage is 0.5%.
Original Length: Uncertainty of +/- 0.001m. Length was 0.542m, so uncertainty is 0.18%.
Extension: Uncertainty of +/- 0.001m. Ranges from a length of 0.009m with 11% uncertainty, to a length of 0.129m with 0.78% uncertainty.
Table of Results – Third Experiment
Error and Uncertainty
See first experiment results for explanation.
Area: Uncertainty of +/- 0.001mm. Diameter of 0.19mm, so uncertainty percentage is 0.53%.
Original Length: Uncertainty of +/- 0.001m. Length was 0.459m, so uncertainty is 0.22%.
Extension: Uncertainty of +/- 0.001m. Ranges from a length of 0.013m with 7.7% uncertainty, to a length of 0.129m with 0.88% uncertainty.
Average values for Young’s Modulus (GPa)
Calculated from Region of Elasticity only
Breaking point of the nylon (force in Newtons/N)
Graphs of Results from Experiments 1 – 3
To analyse my data and begin interpreting my findings from the experiments, I decided to plot of stress against strain values for each one.
The graph of each experiment can be found on the next three pages. Through research earlier in my project I am able to identify different areas of the graphs. These are identified in red on the graphs and a description of each is provided below.
Region of Elasticity
This region of the graph is identified as the part where the points most closely appear to form a straight line. This straight line (which I have plotted through ‘line of best fit’ method) represents Young’s Modulus. Any force applied in this area will have a non-permanent stretching effect on the material, and the material will return to its original state when the force is released. This is the only part of the graph suitable for gathering the Young’s Modulus value.
Strain-hardening curve
This region of the graph begins to form after the region of elasticity. At this point the material has begun to permanently deform and will no-longer return to its original point, however its strength is now increasing, as displayed by the reducing positive gradient of the curve plot. Again, due to inaccuracies and anomalies, this curve has been plotted through a ‘best fit’ method.
Maximum Strength
This is the point at which the strain-hardening curve reaches its peak point. It displays the maximum possible strength of the material. After this point the curve will begin to drop, representing the necking region and the approach to breaking point.
Breaking Point
This is the point at which the material has weakened to rupturing point and displays the stress required to break the material.
Analysis of the Graphs
The graph from the first experiment corresponded to what my research had told me that I should expect to find. There is a clear elastic region at the start of the graph followed by a strain-hardening region. I am lead to believe that in this experiment, the nylon ruptured early, as the curve appears to not quite make it to its true peak (the maximum strength of the material), and there is no visible necking region before the breaking point, which I would have expected to find. There are many possible reasons for the premature breakage and it most likely lies down to a random error where the cause could not be documented, possibly a knock that the nylon received pushing it beyond its true rupturing point. The graph shows that the Young’s Modulus region of the material occurs up to a force of around 3.924N (400g of weight).
In the first graph, most points have remained very close to the line of best fit, with the only anomalous result seeming to be the drop in a point at 2.91x10⁸ Pa of stress, as the strain value seems too low for the trend of the graph. This was most probably a reading error, as no other results appear to be affected in this way.
The graph of the second experiment appears to show a very obvious error that has occurred after 2.94x10⁸ Pa of stress was added, and this error has affected all further readings taken, as there is a large and unexplained jump in stress values from this point. The most likely reason I can predict for the error is a slight slip at the point where the nylon was clamped onto the apparatus, but there is no way to be certain why this happened. Nevertheless, there are similarities to the first graph, especially in the area which is of most importance to me, the elastic region. This again forms a clear straight line up to a weight of 400g was added before the trend line begins to curve, though not quite so obviously as with the first graph.
Since the jump in results was clearly an error, I have split my line of best fit to show a continuation of the curve through the four points that were affected by the error. With this practice applied to the curve, it is clear that it does in fact follow the same sort of trend as the first graph. Since the nylon also ruptured at 13.734N, as with the first experiment, and the lack of rupturing point, I can probably conclude that this experiment also ruptured early and the material failed to reach its maximum strength.
The graph of the third experiment again seems to present points towards the end which go against the research I had conducted earlier, displaying an increasing gradient at the end of the curve rather than the levelling off and necking region that I had expected. However, with the exception of these results, a very normal graph can be plotted that again clearly shows a region of elasticity where Young’s Modulus is valid, followed by a strain-hardening region.
In this experiment, the nylon withstood a greater amount of stress before rupturing, however with still no necking region visible, I have to declare the results for breaking point inconclusive.
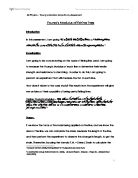
Closer Investigation of the Region of Elasticity
My graphs from the first three experiments have helped me to identify the region of elasticity of the nylon. This is the region from which I will be able to deduce my conclusions to this investigation by calculating the Young’s Modulus value of the material.
The problem now encountered is that the straight line portion of my graphs contains only four point plots. To calculate Young’s Modulus from just four plots could prove extremely inaccurate.
I have therefore decided to carry out one further experiment in which I will more closely examine the area of elasticity to get more points to plot and therefore greater accuracy in my final investigation conclusions.
My graphs indicate that the elastic region lies up to a force of 3.924N. I am therefore going to conduct an experiment very similar to that of the original ones, but applying weights in intervals of 10g (0.0981N) up until the end of the region of elasticity at 400g. This will allow me to the plot a final straight-line graph to calculate Young’s Modulus with 40 points, allowing for much more accurate results and greater room for mitigating the effects of anomalous results.
Results – Closer Investigation of Region of Elasticity
Analysis of the Graph
As this experiment was conducted solely within the region of elasticity, the results taken form a straight line with constant gradient. This straight line represents the Young’s Modulus value of the material.
By calculating a triangle of ∆x and ∆y, I can determine the Young’s Modulus value of nylon from my graph. ∆x represents a value for stress and ∆y represents a value for strain.
The triangle of ∆x and ∆y, along with their measurements are shown on the graph. My calculations for the Young’s Modulus value are shown below:
My calculated final value for Young’s Modulus is therefore 0.9 GPa. This is the value that I would obtain by plotting any size of ∆x / ∆y triangle on my straight line graph as it is a constant value.
Conclusion
I have determined through this investigation that the nylon tested in my closer experiment of the elastic region had a Young’s Modulus value of 0.90GPa. This is however a disputable result, as my original three experiments showed an average Young’s Modulus value in the elastic region of 1.53GPa, and my hypothesis predicted that the value should at least have been around the 2GPa region.
Having fully examined my results and techniques I am still unable to provide an explanation for this strangely low value for Young’s Modulus, and as such would have to say that this is an inconclusive result. I cannot for certain say that there has been an error, as any error appears to have been random and untraceable, but I am also in no position to fully confirm that this value is the true correct Young’s Modulus of the nylon that I tested.
I have also determined through this investigation that the mean breaking point of the nylon was at a force of 15.042N. It should however be noted that my graphs all seem to suggest earlier breaking points occurred than should perhaps have been expected, and also that the modal average breaking point was much lower at 13.734 due to two premature breakages.
Evaluation
This investigation has successfully provided me with the values I aimed to obtain at the outset, however there are some questionable results and values that may have been the result of errors in my experiments, meaning that this is an essentially inconclusive investigation that will require further work to confirm my conclusions and obtain more reliable results.
Errors, Anomalies and Technique
-
Human Error
Since this experiment relied mostly on human eyesight for the reading of values there is a good chance that inaccurate values and errors have at some point been recorded. The naked eye is very vulnerable to mistakes in readings and misperceptions of values.
The experiment also relied heavily on human involvement when applying weights to the nylon and keeping the nylon from being interfered with. If weights were to be applied too aggressively and/or the nylon accidentally knocked, there is a chance of the readings from that point suffering from error. This is especially important when considering the point at which the nylon ruptured on each occasion, as it may have been weakened through human intervention at some point in the experiment.
-
Significant Error Possibilities
These are points in the investigation that, should an error occur at this point, would seriously affect the entire outcome of the investigation or experiment.
Probably the most significant point where an error could have been made was the measurement of cross-section area. Not only was this a very small reading for diameter, but having this value then reduced further when converted to radius in meters, and then squared, means that the final value for area could suffer significantly from error.
Also notable here is the reading for original area, which is only measured once, and therefore if read wrong, would seriously affect the entire set of values for strain in that particular experiment’s results with a systematic and repetitive mistake.
-
Variation in Readings
The breaking point of the nylon should always have been the same value. Whilst the first two experiments broke at the same point, the third experiment took much more weight before breaking. This clearly highlights an error in one set of results. It would seem to suggest that the two experiments with low breaking points suffered from error and therefore means that my results for the value of breaking point suffer from a very high level of uncertainty.
-
Anomalous Results
In general, the effect of anomalous results on this experiment was very limited. Enough readings were taken in each experiment to clearly highlight where anomalies had appeared, allowing these values to be discounted and therefore not influence any results or averages where applicable. Any anomalies that were found tended to be small and insignificant, with no huge deviations from the trend of results.
-
Experimental Technique
Using a manual wooden ruler, accurate only to 1mm, left large room for error when taking readings in the experiments. The layout of my apparatus in general also created reliability problems, as I had to make sure I was perfectly level with the bottom of the nylon thread to take an accurate reading, and with the amount of readings being taken it is likely that there was a mistake made during this process at some point.
Some parts of the experiment however used better technique, for example the micrometer which was accurate to 0.001mm provided very accurate results of the reading for diameter which means my cross-section area values are of good reliability.
Suggestions for Improvement and Further Work
Since my values for Young’s Modulus proved to be questionable, I would suggest that further investigation needs to be carried out in order to achieve a more conclusive result.
It would be a good idea to repeat the investigation of the elastic region two more times so that greater accuracy can be achieved by calculating an average final value from the three experiments.
The experiments all seemed very vulnerable to sources of human error and so in future investigations I believe the set-up and technique needs to be adjusted to reduce the reliance on human measurements and contact with the nylon.
Upon obtaining a more reliable conclusion for the nylon investigation, I would also suggest expanding the investigation to new types of material so that the behaviours and values of different types of material can be analysed. A good proposal for this would be to see how polymers, such as nylon, react differently to metals or brittle materials when stress is applied.