There are many factors influencing these changes, here are a few, the change in the British industry (manufacturing to service industry) has made a huge impact, in 1911 80% of workers were in manual occupations, this number fell to 32.7% in 1991 and is approximately 25% today. Globalisation has also contributed as raw materials and goods can be produced more cheaply elsewhere in the world. Technological advancement has changed the way we work by replacing some blue collared jobs and breaking down complex white collar skills such as book keeping into simplistic routine tasks. Migration has made it easy for employers to gain cheap labour, however the national minimum wage has made it more expensive and what was once a well-paid job of the middle class has now been brought down to an average wage.
Sharon Lynas
The income distribution has also changed due to those same factors.
Between 1979 and 1997 income inequality between the rich and the poor in Britain widened, it was at it’s most unequal since records began at the end of the nineteenth century. Poverty in Britain has definitely increased, between 1979 and 1997 the number of children living in poverty rose by 40% and it has been suggested that the
U.K. is the worst place in Europe to grow up, approximately 25% of children will
never escape the poverty trap also the poorest 20 –30% of the population failed to
benefit from the economic growth over the period 1979 – 1992. In contrast the redistribution of wealth has only been shared by the wealthy top 10%.
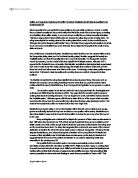
The chart below shows the distribution of wealth in the U.K. between 1976 and 2003.
Marketable wealth Percentages
Percentage of wealth owned by:
1976 1986 1996 1999 2000 2001 2002 2003
Most wealthy 1% 21 18 20 23 23 22 24 21
Most wealthy 5% 38 36 40 43 44 42 45 40
Most wealthy 10% 50 50 52 55 56 54 57 53
Most wealthy 25% 71 73 74 75 75 72 75 72
Most wealthy 50% 92 90 93 94 95 94 94 93
Total marketable wealth
(£ Billion) 280 955 2,092 2,861 3,131 3,477 3,588 3,783
When all the socialogists theories of social class are taken into account, a mixture of all five (expansion and fragmentation, embourgioisement, new working class and privatisation, proletarianisation and polarization) is present today.
Zweig’s theory of expansion and fragmentation in the middle class is in some ways correct as the primary and secondary industries decline the traditional blue collar work is now becoming white collar work although the conditions of work and pay have not increased in line with the status, with more people joining the middle class (embourgeoisment) it is apparent that fragmentation is taking place within this sector. Goldthorpe and Lockwood’s theory of the new working class has highlighted members who do not enjoy the benefits of the middle class i.e. expense accounts, company cars, pensions and sick pay, also having to work longer hours, however I believe these members are at the lower end of the middle class as opposed to there being a separate class and that there is a boundary problem between middle class and working class. Braverman’s theory of proletarianisation is also evident with
Sharon Lynas
technology taking over the skills needed, simplifying many complicated and complex
tasks by removing the need for core knowledge of the operation it is performing, de-skilling has taken place and control over the work process has been removed from many non-manual workers. A part of Marx’s theory of polarization has also occurred. In 1997 the average income rose by 36% however, 10% of the top earners gained a 62% rise compared with the bottom 10% of earner who had a decrease of 17%. It is obvious that the wealthy are flourishing and the poor are struggling but Marx’s theory does not account for the people in-between the gap.
Question 4
There have been three different scales for measuring social class, the first was The Registrar General scale (1911 – 1990). For the first sixty years ranking was based on the “standing in the community” from 1981 the criteria changed to occupation skill. Other aspects were non-manual workers were placed above manual workers, the male being head of the household (malestream). The problems with this scale are, manual and non manual divide and the assessments of jobs were by the Registrar General’s own staff who could be bias towards the middle class, they also failed to recognise the unemployed and distinguish between employed and self employed. With the scale based on the male, women were largely ignored assigning them to the class of their husbands, with all this taken into account the scale was not accurate.
The second was Hope Goldthorpe scale, this scale was better at reflecting the nature of the British class system. Goldthorpe introduced three main divisions which the class groupings were placed, Service, Intermediate and working class. It recognised the growth of the middle class and the fragmentation taking place, it also takes into account market positions (income and economic life chances such as promotions, sick pay and hours worked). Self-employment had also been accounted for. The problems are, it acknowledged that both manual and non manual share similar experiences of work but it still placed non manual over manual and women still had no place, even if they were in a higher grade occupation than their husbands. Although this scale takes more of the society into consideration it still doesn’t show the full picture.
The scale which is used today is the NS-SEC, based on employment relations and market conditions, other amendments are the unemployed are now listed as class 8, women are now recognised as a distinct group of wage earners. Each category contains both manual and non-manual workers with there no longer being a divide, it also recognises changes in the occupation structure (worsening pay and conditions). This scale weakness is, it is still based on occupation and the boundary problem is still evident. Although the unemployed are now included, people who don’t need to work due to wealth are still unaccounted for and it doesn’t show status occupations. In conclusion, the NS-SEC is the most accurate in comparison it still has a long way to go to reflect the full structure.
Sharon Lynas
Bibliography
Books
Moore.S, (2002,) Sociology for A2, London, Collins Educational.
Haralambos and Holborn, (2004,) Sociology Themes and Perspectives, 6th Edition, London, Harper Collins.
Giddens, (2001,) Sociology, 4th Edition, Cambridge, Polity Press.
Matheson.J and Summerfield.C tds, (2000,) Social Trends 30, 2000 Edition Office for National Statistics, London, The Stationary Press.
Moore.S etal, (2002,) Sociology for A2, London, Harper Collins.
O’Neill.T, (2003,) National Geographic Magazine, June Edition, New York, Sean Flanagon.
Website
National Statistics, 8/5/06, Share of the Wealth, , 9/10/08
Sharon Lynas