Task 2
Demand is defined as the amount of a good or service that is bought at a particular price over a particular period of time. Demand for a product or a service is determined by a number of factors. While some of these are economic in nature and can be measured, others are hard to quantify. For instance, one of the many factors that determine demand is the price of the product or service which is measurable.
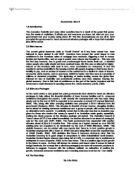
The diagram above shows the demand curve. It is seen that when price changes there is a movement along the demand curve. When a variable other than price changes, it causes a shift of the demand curve. Refer to diagram below.
The demand curve shifts to the left if the change decreases demand and to the right if the change increases demand.
The shape of the demand curve is determined by two main factors: The substitution effect:
When the price of a product rises and that of its substitutes remain constant, consumers will shift to the relatively cheaper substitutes. Thus quantity demanded will fall.
The income effect:
A rise in the price of a good results in a decrease in the consumer’s real income which in turn decreases demand and vice-versa.
Aggregate demand curve is the sum of all demands for all the goods and services in all markets also known as the Gross National Product. Aggregate demand = Consumption + Investment + Government spending + Net exports.
The aggregate demand curve traces the quantity of real GNP demanded as the price levels vary.
If factors other than price vary, the AD curve shifts. The factors that cause a shift in the AD curve are:
Fiscal policy
Monetary Policy
Foreign income changes
External shocks
Expectations
The AD curve slopes downwards because of the following reasons:
A firm in the short run has at least one factor of production that is fixed and at least one that is variable. When the output of the firm changes, the proportion of the factors used also changes. If the output increases, then each unit of the variable factor has less of the fixed factor to combine with. If, on the other hand, output decreases, then each unit of the variable factor has more of the fixed factor to combine with. Thus the pattern of the output is predictable. This is known as the Law of Diminishing Returns. The law states, ‘if some inputs are increased whilst at least one other is fixed then whilst the extra output produced by each extra unit of input may at first increase, it will reach a point after which it will diminish’. This is known as the point of diminishing returns. Diminishing returns occur because each extra unit of input has less of the fixed input to work with. In other words, after a point, marginal output will decline. This is known as the point of diminishing marginal returns.
A firm’s output in the short run, will be at the point of optimum returns where each additional unit of input results in a greater or equal amount of output.
In the long run, all of the factors of production are variable. Therefore, a firm can change all of its inputs proportionately. This results in a change in the firm’s scale of production. There are three potentials outcomes when inputs are increased. If a percentage increase in input results in a proportionate increase in output, the firm is said to experience constant returns to scale. If the output increases less than proportionately, the firm is said to experience decreasing returns to scale. If the output increases more than proportionately, the firm is said to experience increasing returns to scale. Sources of increasing returns to scale include technical, financial, marketing, purchasing, and managerial economies.
In the long run, a firm can decide to operate in either increasing returns of scale or constant returns to scale.
Task 3
Demand is the amount of a good that is bought at a particular price over a period of time. Demand and price are inversely related and the law of demand states, ‘if the price of a product increases, then the quantity demanded will fall and if the price of a product decreases then the quantity demanded will rise.
Supply is a function of its own price. The law of supply states, ‘Ceteris Paribus, the higher the price of a good or service the more the sellers will supply’. There is a positive
relationship between price and the quantity supplied.
The supply curve in the diagram above shows that with every increase in the price, the quantity supplied will also increase.
A change in any variable other than price will result in the shift of the supply curve. Variables that cause a shift in the supply curve are:
- change in the price of substitute producer goods
- change in the price of the factors of production
- government action
- Improvements in technology
- industry specific factors such as weather etc.
A leftward shift in the supply curve indicates a change that decreases supply of goods and services and the rightward shift of the supply curve indicates a change that increases supply goods and services.
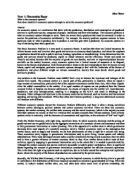
Equilibrium price is the price at which the quantity demanded of a good or service is equal to the quantity supplied of the same. This is illustrated in the diagram below
In the diagram above, the point at which the demand and supply curve cut through each other is known as equilibrium price. At the point demand equals supply and the market is known to be in equilibrium. At this price point there is neither upward nor downward pressure.
At any other point on the graph, there is disequilibrium. This means that either there is excess demand, known as shortage; or there is excess supply known as glut. At any price lower than x, there will be a shortage and market forces will tend to force price levels back up to the point of equilibrium. Willing buyers who cannot obtain the good will offer a higher price and suppliers realising that they can sell at a higher price will raise the price.
At any point above x on the graph, there is excess supply or glut. This means that there us a surplus in the market. To get rid of the excess, sellers cut prices. This drives the price back downwards towards the point of equilibrium.
Task – 4
a) Explain clearly what is meant by perfect competition.
b) Explain clearly what is meant by oligopoly.
Oligopoly
Oligopoly is a market structure that is characterized by a limited number of firms. The number of firms can be as low as two or as high as one hundred. Even if the industry has a fairly large number of firms, it will be dominated by a few of the larger firms. An oligopolistic market has high barriers to entry, preventing other firms from entering the market. These barriers might be production, investment, marketing or technological costs.
Due to the small number of competitors, firms in an oligopoly are highly interdependent. While the firms consider themselves rivals, they always consider the reaction of other firms while making their decision on price and output. In the airline industry for example, if one airliner reduces its prices for a particular sector, one can be sure that all its competitors will follow suit. The interdependence between firms ensures price stability over long periods of time. The interdependence also results in the firms engaging in non-price competition. They do however compete through fierce advertising and branding of their products. This makes marketing a very important function in an oligopoly. Firms also aim to increase market share by creating brand loyalty by launching new offers such as free gifts etc.
Perfect Competition
Perfect competition is a market structure that is characterized by the absolute or total competition between firms. While the conditions required for perfect competition may not exist in the real world, some markets do come close, displaying a very high degree of competition. The agricultural industry is probably the closest to displaying perfect competition.
The perfect competition model assumes that the firm is a price taker, meaning that the firm has to produce output at a price that is determined by the demand for the product. However, there are some requirements to be met for a firm to end up as a price taker. They are:
- There are many buyers
- There are many sellers.
- The products are homogenous.
- There are no barriers to entry.
- There is perfect knowledge. Both buyers and sellers are completely informed about the products and the prices of each firm in the industry.
Due to the facts that the products are identical, there are a large number of buyers and sellers and there are no barriers to entry, sellers have no control over the price of their product. As a result, all products in a perfect competition have a perfectly elastic demand curve, meaning that firms can sell as much of their product as they want at a certain price but nothing at changed price.
The diagram above shows that all firms in a perfect competition are price takers, meaning that the price of the product is determined entirely by the market. Firms in a perfect competition are profit maximisers and therefore it is irrational for them to sell at a lower price.
A market in perfect competition is likely to be both allocatively and technically efficient.
Allocative efficiency occurs because suppliers are producing the optimal mix of goods and services required by the consumers. The consumer is sovereign. Demand is a tool that measures the preferences of consumers. If a good becomes less preferable and another becomes more preferable, the demand for the latter will increase, causing a shift in the demand curve to the left and lowering its price. Demand for the other good will shift and increase the price. Under the conditions of a perfect competition, producers have to react to changes in demand.
As price rises in one industry due to increasing demand, resources like land, labour and capital are relocated from the declining industry to the expanding industry. This continues to happen through the period of supernormal profits until firms are making normal profits. Normal profits indicate that the mix of goods and services being produced are in the quantity that the consumers want.
TASK 5
a) An explanation and evaluation of what is meant by Keynesian economics.
b) An explanation and evaluation of what is meant by Monetarist economics.
Keynesianism is named after John Maynard Keynes, a British economist who lived from 1883 to 1946. He was a man of many contradictions: an elitist whose economic theories would be embraced by liberals the world over, a genius with an uncanny ability to predict the future, but whose works were often badly organized and sometimes very wrong.
When the Great Depression hit worldwide, it fell on economists to explain it and devise a cure. Most economists were convinced that something as large and intractable as the Great Depression must have complicated causes. Keynes, however, came up with an explanation of economic slumps that was surprisingly simple. In fact, when he shared his theory and proposed solution with Franklin Roosevelt, the President is said to have dismissed them with the words: "Too easy."
Keynes explanations of slumps ran something like this: in a normal economy, there is a high level of employment, and everyone is spending their earnings as usual. This means there is a circular flow of money in the economy, as my spending becomes part of your earnings, and your spending becomes part of my earnings. But suppose something happens to shake consumer confidence in the economy. (There are many possible reasons for this, which we'll cover in a moment.) Worried consumers may then try to weather the coming economic hardship by saving their money. But because my spending is part of your earnings, my decision to hoard money makes things worse for you. And you, responding to your own difficult times, will start hoarding money too, making things even worse for me. So there's a vicious circle at work here: people hoard money in difficult times, but times become more difficult when people hoard money.
The cure for this, Keynes said, was for the central bank to expand the money supply. By putting more bills in people's hands, consumer confidence would return, people would spend, and the circular flow of money would be re-established. Just that simple! Too simple, in fact, for the policy-makers of that time. The re-emergence of Keynesianism is testimony of its staying power. Almost certainly, future economic theories will incorporate its findings. ()
Monetarism is a line of reasoning emanating from the Quantity Theory. In a very early version, often called the crude quantity theory, prices on the average grew proportionally to the growth rate of money: Money times it Velocity equals Total Spending. Real output times it prices is the current dollar value of total output, today referred to as GDP. Since there are more than one definition of money and these definitions have changed over the years, a rough approximation of what money meant in this context would be what is called M-2 or thereabouts. The link between spending and money is referred to as the velocity of money. For example, if nominal or current dollar GDP for a year is 100 and the average quantity of money during that period is 50; the velocity of money is 2.
()