Inequality in the UK
The Oxford English Dictionary defines inequality as "the quality of being unequal or uneven". The instance of being unequal may arise from the disparity of distribution or opportunity and spans all social dogmas including: gender, race, political or religious persuasion. There are many forms of measuring inequality wealth, consumption and opportunity but there are problems inherent in each. Perhaps the most effective way of measuring inequality is comparing income earned, as there is sufficient raw data, it is easily conceptualised and it does not entail normative statements or value judgements.
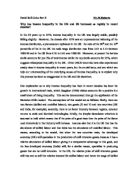
The most widely used measure of income inequality in society is the Gini co-efficient. It is a precise way of measuring the position of the Lorenz curve (see diagram below), a graph that shows, for the bottom x% of households, the percentage y% of the total income which they have. To compute the Gini Coefficient, the area between the Lorenz Curve and the 45 degree equality line is measured. This area is divided by the entire area below the 45 degree line (which is always exactly a 1/2). The quotient is the Gini coefficient, a measure of inequality, expressed as a percentage or as the numerical equivalent of that percentage, which is always between 0 and 1. The higher the figure for the Gini co-efficient, the greater is the degree between high and lower income households. For a perfectly equal distribution, where every household is earning exactly the same, there would be no area between the 45 degree line and the Lorenz curve-a Gini coefficient of zero. For complete inequality, a single household earning a country's entire income, the Lorenz curve would coincide with the straight lines at the lower and right boundaries of the curve, making the Gini coefficient one. Typically developed countries have a Gini-co efficient rating between 0.2 and 0.4.
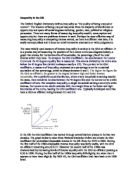
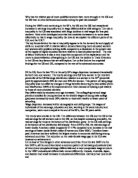
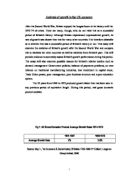
In the UK the Gini coefficient has moved through several distinct phases in the last two decades. The graph below is taken from National Statistics Online and shows the Gini coefficient for equivalised disposable income in the UK from the 1979 to 2002. During the first half of the 1980s disposable income inequality was fairly stable, with the Gini co-efficient remaining around 0.27. However the second half of the 1980s was characterised by increasing levels of income equality with the Gini co-efficient peaking at 0.36 in 1990. During the first half of the 1990s inequality fell slightly, but since then it appears to have risen slightly. By 2001-02, the Gini coefficient had risen back to its 1990 level.
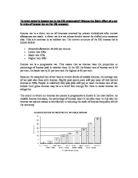
Ultimately the level of income one earns will have a direct effect on the wealth they accumulate. Wealth is considerably less evenly distributed than income. Life cycle effects mean that this will almost always be so: people build up assets during the course of their working lives and then draw them down during the years of retirement with the residue passing to others at their death. The fact that the income gap is widening only means the distribution of wealth is becoming more unequal. It is estimated that the wealthiest 1 per cent of individuals owned between a sixth and a quarter of the total wealth of the household sector in the last decade. In contrast, half the population shared between them only 6 per cent of total wealth in 2000.
The Oxford English Dictionary defines inequality as "the quality of being unequal or uneven". The instance of being unequal may arise from the disparity of distribution or opportunity and spans all social dogmas including: gender, race, political or religious persuasion. There are many forms of measuring inequality wealth, consumption and opportunity but there are problems inherent in each. Perhaps the most effective way of measuring inequality is comparing income earned, as there is sufficient raw data, it is easily conceptualised and it does not entail normative statements or value judgements.
The most widely used measure of income inequality in society is the Gini co-efficient. It is a precise way of measuring the position of the Lorenz curve (see diagram below), a graph that shows, for the bottom x% of households, the percentage y% of the total income which they have. To compute the Gini Coefficient, the area between the Lorenz Curve and the 45 degree equality line is measured. This area is divided by the entire area below the 45 degree line (which is always exactly a 1/2). The quotient is the Gini coefficient, a measure of inequality, expressed as a percentage or as the numerical equivalent of that percentage, which is always between 0 and 1. The higher the figure for the Gini co-efficient, the greater is the degree between high and lower income households. For a perfectly equal distribution, where every household is earning exactly the same, there would be no area between the 45 degree line and the Lorenz curve-a Gini coefficient of zero. For complete inequality, a single household earning a country's entire income, the Lorenz curve would coincide with the straight lines at the lower and right boundaries of the curve, making the Gini coefficient one. Typically developed countries have a Gini-co efficient rating between 0.2 and 0.4.
In the UK the Gini coefficient has moved through several distinct phases in the last two decades. The graph below is taken from National Statistics Online and shows the Gini coefficient for equivalised disposable income in the UK from the 1979 to 2002. During the first half of the 1980s disposable income inequality was fairly stable, with the Gini co-efficient remaining around 0.27. However the second half of the 1980s was characterised by increasing levels of income equality with the Gini co-efficient peaking at 0.36 in 1990. During the first half of the 1990s inequality fell slightly, but since then it appears to have risen slightly. By 2001-02, the Gini coefficient had risen back to its 1990 level.
Ultimately the level of income one earns will have a direct effect on the wealth they accumulate. Wealth is considerably less evenly distributed than income. Life cycle effects mean that this will almost always be so: people build up assets during the course of their working lives and then draw them down during the years of retirement with the residue passing to others at their death. The fact that the income gap is widening only means the distribution of wealth is becoming more unequal. It is estimated that the wealthiest 1 per cent of individuals owned between a sixth and a quarter of the total wealth of the household sector in the last decade. In contrast, half the population shared between them only 6 per cent of total wealth in 2000.