where y is the variable, t is the current time period and n is the number of time periods in the average
For example annual rate from third Quarter of 2001 till the 3 Quarter in 2002
Y3Q2002 = (4+1.3+5+2.7) / 4 = 3.25
The next three quarters show an average growth of only 1.9 % but the extremly high GDP in the third quarter of 2003 with a growth rate of 7.2% in October 2003 has a significant surge from its pre-recession peak leads to a second annual rate after the start of the recovery in November 2001 of 3.3%.
The economy grew in October is the fastest pace since the first quarter of 1984, the Bureau of Economic Analysis (BEA) reported in its advance release of gross domestic product data. Underlying this growth was a surge in consumer spending, fuelled by tax cuts and a mortgage refinancing boom and by a large increase in business investment. In addition, a declining trade deficit and moderate increases in government spending helped fuel the economic growth.
To sum up GDP has expanded at an average annual rate of 3.3% since the 4th quater of 2001.
Poor development in Employment
With the statement of the end of the recession in November 2001, the US population expected the employment rates to rise with the GDP. Employment growth usually plays an important roll at this stage of the economic cycle. A pickup in employment is normally a prerequisite for sustainable economic growth and there for watched by the Federal Reserve. Employment is generally recognized as a “lagging indicator “ , meaning that the recovery in employment doesn´t begin until the recovery in economy has been underway for a period of time. The chart below shows in the sixties and eighties employment started to improve a few months after the recession. In 1990 the expression “jobless recovery” became more and more important as an explanation for the phenomen that the employment numbers did not respond the economic recovery after a full year after the end of the recession. By 1993 a full recovery was underway and 3 million jobs were created in that year and another 4 million in 1994.
This time the lag has been greater. The upturn in GDP begann in the 4th quarter of 2001 and expanded now for two years while there is still no job growth. Even worse the job numbers are still falling . The unemployment rate calculated as:
where gt is the growth rate in period t, x is the variable being examind (e.g. umemployment figures) and n is the time period of interest
has been at or above 6.0% since April and above 5.6% since the recovery commenced in November 2001.
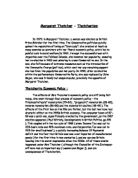
An absence of job growth has been a feature of the current cycle. Chart 1 compares payroll growth or lack of it in the current recovery with both the average from previous cycles (1945 –1990) and the ‘jobless’ recovery in the early 1990’s. To index numerical data, values must be adjusted so they are equal to each other in a given starting time period. By convention, this value is usually 100
where is the raw data value in a given time period from t = months of recovery is the data value in the initial time period, and is the new indexed value of the variable.
After this calculations the result shown in the graph tells that the decline in payroll job growth of 2001 and 1991 during the recession was higher than the average of the last recessions. But whereas in 1991-92, jobs started picking up substantially 17 months after the trough, the US is currently into the 23rd month of recovery and have yet to see any hard evidence of significant improvement.
The Role of structural change
Is the poor development on the job market a cycial or structural adjustment?
Cycial adjustements are caused by a decline in demand. These job losses are temporary. At the end of a recession laid-off workers are recalled to their old firm or find a comparable job with another industry. “Structural adjustments transform a firm or industry by relocating workers and capital”. The jobs are eliminated as industries decline, workers must search other industries , change their location or skills to find a new job.
As Appendix1 shows productivity of the current recovery is little above the average of the productivity of the last recoveries.
The gap between the employment growth is much bigger. With – 0.5% the employment rate is very poor at the moment compared to 3.3% of the last decades. The growth of output was twice as much as it is today.
These facts show that the US production is more efficient, than it was two years ago. The workforce create the same ammount of output in fewer hours. The low output numbers are a sign for a low demand by consumers and investors.
We compare the current development with the happenings of the last six recoveries.
The graph shows that in the recessions before 1990 the unemployment from layoffs rose throughout the downturn and fell sharply after the through, followed by the decline in total unemployment. In comparison the recession in 1990 and 2000 show a different development.Temporary layoffs contributed little to the path of unemployment.
The labor market dynamic table in Appendix2 shows that the number of job openings is lower than in 2002 and the years before. The drop suggested some role for a weak job creation
Comparing the labor productivity growth with the compensation per worker of the graph in the Financial Times it can be recognized that after a low during the recession for both, the productivity rate growth while the compensation only improves a bit and is still nearly on the same level as in the recession.
All in all another hint that the current high unemployment rate is caracterized by structural adjustments.
Over the long run, most economists agree productivity growth is good for workers, because it tends to lead to higher wages. But in the short run, it's creating a problem. Worker productivity has been growing faster than the overall economy. That has allowed corporate executives to meet small increases in demand while still eliminating jobs.
Permanent job losses are also the result of the competition created by globalization, which has forced companies to cut positions in the U.S. and move them to places such as Mexico, China and India, where labor is much cheaper. Jobs are being created, but not in the US. But the increasingly global nature of American business is still benefiting from that job creation and increased productivity. Not to mention the lower labor costs
Conclusion
The time after the 2001 recession can be described as a jobless recovery. The development of GDP and jobs is conflicting. During the GDP growth, employment figures decline.This can cleary be seen in Appendix 3. After the analysis of the economic situation of the US it is obvious that the situation can be described as a “jobless recovery”.
Structural changes play an important role in the current labor market slump. Industries that lost jobs duing the recession have continued to shrink during the recovery and permanent job losses hav eclipsed temporary layoffs.
Conservatives say that more growth is needed to stimulate jobs, and that requires tax cuts and fewer regulatory barriers to business.
For a sustainable recovery in the labor market, economic growth will need to be above 3.0% due to productivity growth and trends in labor force growth. But there are some signs that a stronger recovery may lie ahead as growth in the second quarter was carried by a variety of factors: a lift in consumption, increases in investment, a strong residential housing market, and more spending by the federal government. In comparison, though, the trade deficit remains the trouble spot of the economy, growing to a new record high
The goal is reached with a annual growth of 3.3 per cent and a new peak of 7.2 per cent. So the future will show if these analysts calculate right.
References
Financial Times 11th October 2003
Schweitzer, Mark.. Another jobless recovery?, March 2003
Financial Times October 2003
www.myinvestmentcounselor.com
current issues in economics and finance