Aggregate supply would shift inwards if there is a rise in the unit costs of production in the economy. For example there might be a rise in unit wage costs perhaps caused by higher wages not compensated for by higher labour productivity.
External economic shocks might also cause the aggregate supply curve to shift inwards. For example a sharp rise in global commodity prices. If AS shifts to the left, assuming no change in the aggregate demand curve, we expect to see a higher price level (this is known as cost-push inflation) and a lower level of real national output.
Impact of a shift in aggregate demand
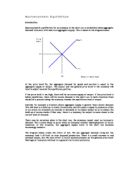
In the diagram below we see the effects on an inward shift in aggregate demand in the economy. This might be caused for example by a decline in business confidence (reducing planned investment demand) or a fall in United Kingdom exports following a global downturn. It might also be caused by a cut in government spending or a rise in interest rates which leads to cutbacks in consumer spending.
The result of the inward shift of AD is a contraction along the short run aggregate supply curve and a fall in the real level of national output. This causes downward pressure on the general price level.
If aggregate demand shifts outwards (perhaps due to increased business confidence, an economic upturn in another country, or higher levels of government spending), we expect to see both a rise in the price level and higher national output.
National Income Equilibrium when Aggregate Supply is Perfectly Elastic
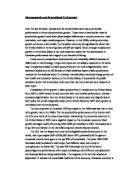
When short run aggregate supply is perfectly elastic, any change in aggregate demand will feed straight through to a change in the equilibrium level of real national output. For example, when AD shifts out from AD1 to AD2 (shown in the diagram below) the economy is able to meet this increased demand by expanding output. The new equilibrium level of national income is Y2. Conversely when there is a fall in total demand for goods and services (AD1 shifts inwards to AD3) we see a fall in real output.
Long Run Economic Growth
We have considered short-term changes in both aggregate demand and aggregate supply. For an economy to experience sustained economic growth over the longer run it must shift out the long run aggregate supply curve by either increasing the supply of factors of production available (e.g. an increase in the labour supply, more land and more capital inputs); increasing the productivity of those factors or the economy might increase LRAS by achieving an improvement in the state of technology.
An outward shift in the LRAS is similar to an outward shift in the production possibility frontier.
The effects are shown in the diagram below. If LRAS shifts out the economy can operate at a higher level of aggregate demand and can achieve an increase in real national output without running into problems with inflation.
One of the main long-term economic objectives of the current Labour government is to raise the economy's productive potential and therefore provide a platform for faster economic growth in future years. For this to happen the economy needs to achieve a higher level of investment in new capital and new technology. And the quantity and productivity of the labour force also needs to increase over time.
Aggregate Demand (AD)
Aggregate demand (AD) is the total demand for goods and services produced in the economy over a period of time.
Defining Aggregate Demand
Aggregate planned expenditure for goods and services in the economy = C + I + G + (X-M)
C Consumers' expenditure on goods and services: This includes demand for durables & non-durable goods.
I Gross Domestic Fixed Capital Formation - i.e. investment spending by companies on capital goods. Investment also includes spending on working capital such as stocks of finished goods and work in progress.
G General Government Final Consumption. i.e. Government spending on publicly provided goods and services including public and merit goods. Transfer payments in the form of social security benefits (pensions, job-seekers allowance etc.) are not included as they are not a payment to a factor of production for output produced. A substantial increase in government spending would be classified as an expansionary fiscal policy.
X Exports of goods and services - Exports sold overseas are an inflow of demand into the circular flow of income in the economy and add to the demand for UK produced output. When export sales from the UK are healthy, production in exporting industries will increase, adding both to national output and also the incomes of those people who work in these industries.
M Imports of goods and services. Imports are a withdrawal (leakage) from the circular flow of income and spending in the economy. Goods and services come into the economy - but there is a flow of money out of the economic system. Therefore spending on imports is subtracted from the aggregate demand equation.
Note: X-M is the current account of the balance of payments
The Aggregate Demand Curve
Aggregate demand normally rises as the price level falls. This can be explained in three main ways:
Real money balances effect
As the price level falls, the real value of money balances held increases. This increases the real purchasing power of consumers.
Prices and interest rates
A lower price level increases the real interest rate - there will be pressure on the monetary authorities to cut nominal interest rates as the price level falls. Lower nominal interest rates should encourage an increase in consumer demand and planned investment.
International competitiveness
If the UK price level is lower than other countries (for a given exchange rate), UK goods and services will become more competitive. A rise in exports adds to aggregate demand and therefore boosts national output.
Shifts in Aggregate Demand
A change in one of the components of aggregate demand will cause a shift in the aggregate demand curve. For example there might be an increase in export demand causing an injection of foreign demand into the domestic economy. The government may also increase its own expenditure and businesses may raise the level of planned capital investment spending.
aggregate supply
Defining aggregate supply
Aggregate Supply (AS) measures the volume of goods and services produced within the economy at a given overall price level. There is a positive relationship between AS and the general price level. Rising prices are a signal for businesses to expand production to meet a higher level of AD. An increase in demand should lead to an expansion of aggregate supply in the economy.
short-run aggregate supply curve
Aggregate supply is determined by the supply side performance of the economy. It reflects the productive capacity of the economy and the costs of production in each sector.
Shifts in the AS curve can be caused by the following factors:
-
changes in size & quality of the labour force available for production
-
changes in size & quality of capital stock through investment
-
technological progress and the impact of innovation
-
changes in factor productivity of both labour and capital
-
changes in unit wage costs (wage costs per unit of output)
-
changes in producer taxes and subsidies
-
changes in inflation expectations - a rise in inflation expectations is likely to boost wage levels and cause AS to shift inwards
In the diagram above - the shift from AS1 to AS2 shows an increase in aggregate supply at each price level might have been caused by improvements in technology and productivity or the effects of an increase in the active labour force.
An inward shift in AS (from AS1 to AS3) causes a fall in supply at each price level. This might have been caused by higher unit wage costs, a fall in capital investment spending (capital scrapping) or a decline in the labour force.
LONG RUN AGGREGATE SUPPLY
Long run aggregate supply is determined by the productive resources available to meet demand and by the productivity of factor inputs (labour, land and capital).
In the short run, producers respond to higher demand (and prices) by bringing more inputs into the production process and increasing the utilization of their existing inputs. Supply does respond to change in price in the short run.
In the long run we assume that supply is independent of the price level (money is neutral) - the productive potential of an economy (measured by LRAS) is driven by improvements in productivity and by an expansion of the available factor inputs (more firms, a bigger capital stock, an expanding active labour force etc). As a result we draw the long run aggregate supply curve as vertical.
Improvements in productivity and efficiency cause the long-run aggregate supply curve to shift out over the years. This is shown in the diagram below