Measurement of National Income, Strengths and Weaknesses of National Income Statistics.
MEASUREMENT OF NATIONAL INCOME, STRENGTHS AND WEAKNESSES OF NATIONAL INCOME STATISTICS
Introduction
National income is defined as the sum of the incomes accruing to factors of production supplied by normal residents of the given country before deduction of taxes
Measures of national income and output are used in economics to estimate the value of goods and services produced in an economy. They use a system of national accounts or national accounting developed by Simon Kuznets in the 1960s. Some of the more common measures are Gross National Product (GNP), Gross Domestic Product (GDP), Net National Product (NNP), and Net National Income (NNI)
Analysis
Circular Flow of Income
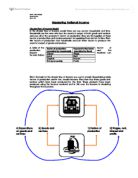
The figure below divides the economy into two sections or sectors made up of households and firms.
[Source]1
There are two types of flow (an amount per time period) between these groups:
A real flow. Households own factor services which they hire out to firms. Factor services are then used to manufacture goods and services.
A money flow. Households receive payments for their services (income) and use this money to buy the output of firms (consumption).
Leakages or Withdrawals From the Circular Flow
Not all income will flow from households to firms directly. The circular flow below shows that some part of household income will be:
* Put aside for future spending, ie saved.
* Paid to the government in taxes.
* Spent on foreign made goods imported into the country.
]2
Injections Into the Circular Flow
These flows out of the circular flow of income will be counterbalanced by flows back in. These flows are known as injections. These may take the form of:
* Other firms, ie investment expenditure.
* The government, ie government expenditure.
* Foreigners, ie export expenditure.
The diagram shows the impact of these injections on the circular flow:
[Source]3
When there is an increase in the level of injections a part of it will be received by a household as extra income. The households will probably act so that part of this extra income is then spent and part is saved.
This extra consumer spending then gives rise to a series of further incomes and expenditures. The overall increase in spending is much higher than the initial injection. This effect is known as the multiplier effect. The greater the proportion of the extra income that is spent (the Marginal Propensity to Consume), the bigger the multiplier effect will be.
National Income Measurement
There are at least two or three different ways of calculating these numbers. The expenditure approach determines aggregate demand, or Gross National Expenditure, by summing consumption, investment, government expenditure and net exports. On the other hand, the income approach and the closely related output approach can been seen as the summation of consumption, savings and taxation. The three methods must yield the same results because the total expenditures on goods and services (GNE) must by definition be equal to the value of the goods and services produced (GNP) which must be equal to the total income paid to the factors that produced these goods and services (GNI). (GNP=GNI=GNE by definition)
Gross National Product (GNP) is the total value of 'final goods' and services produced in a year by domestically owned factors of production.
Final goods are goods that are ultimately consumed rather than used in the production of another good. For example, a car sold to a consumer is a final good; the components such as tires sold to the car manufacturer are not; they are intermediate goods used to make the final good. The same tires, if sold to a consumer, would be a final good. Only final goods are included when measuring national income. ...
This is a preview of the whole essay
Gross National Product (GNP) is the total value of 'final goods' and services produced in a year by domestically owned factors of production.
Final goods are goods that are ultimately consumed rather than used in the production of another good. For example, a car sold to a consumer is a final good; the components such as tires sold to the car manufacturer are not; they are intermediate goods used to make the final good. The same tires, if sold to a consumer, would be a final good. Only final goods are included when measuring national income. If intermediate goods were included too, this would lead to double counting; for example, the value of the tires would be counted once when they are sold to the car manufacturer, and again when the car is sold to the consumer.
Only newly produced goods are counted. Transactions in existing goods, such as second-hand cars, are not included, as these do not involve the production of new goods.
Income is counted as part of GNP according to who owns the factors of production rather than where the production takes place. For example, in the case of a German-owned car factory operating in the US, the profits from the factory would be counted as part of German GNP rather than US GNP because the capital used in production (the factory, machinery, etc.) is German owned. The wages of the American workers would be part of US GNP, while the wages of any German workers on the site would be part of German GNP.
Gross Domestic Product (GDP) is the total value of final goods and services produced within a country's borders in a year.
GDP counts income according to where it is earned rather than who owns the factors of production. In the above example, all of the income from the car factory would be counted as US GDP rather than German GDP.
To convert from GNP to GDP you must subtract factor income receipts from foreigners that correspond to goods and services produced abroard using factor inputs supplied by domestic sources. To convert from GDP to GNP you must add factor input payments to foreigners that correspond to goods and services produced in the domestic country using the factor inputs supplied by foreigners 4
GDP is a better measure of the state of production in the short term. GNP is a better when analysing sources and uses of income.
In actual fact, there will be minor differences in the results obtained from the various methods due to changes in inventory levels. This is because goods in inventory have been produced (and therefore included in GDP), but not yet sold (and therefore not yet included in GNE). Similar timing issues can also cause a slight descrepency between the value of goods produced (GDP) and the payments to the factors that produced the goods (particularly if inputs are purchased on credit).
The Difference between GDP and GNP
Gross National Product (GNP) measures the final value of output or expenditure by UK owned factors of production whether they are located in the UK or overseas. GDP is only concerned with incomes generated within the geographical boundaries of the country. So output produced by Nissan in the UK counts towards our GDP but some of the profits made by Nissan here are sent back to Japan - adding to their GNP.
GNP = GDP + Net property income from abroad (NPIA)
The following table shows the various techniques used to measure national income:
Table: 1 Approaches for Measuring National Income [Source]5
Expenditure Method (Aggregate Demand)
This is the sum of the final expenditure on UK produced goods and services measured at current market prices. The full equation for GDP using this approach is
GDP = C + I + G + (X-M)
C: Household spending (consumption)
I: Capital Investment spending
G: General Government spending
X: Exports of Goods and Services
M: Imports of Goods and Services
The Income Method (Sum of Factor Incomes)
Here GDP is the sum of the final incomes earned through the production of goods and services:
o Main Factor Incomes
o Income from employment and self-employment
o Added to Profits of companies
o Added to rent income
Only factor incomes generated through the production of output are included in the calculation of GDP by the income approach. Therefore, we exclude from the accounts the following items:
o Transfer payments (e.g. the state pension, income support and the Jobseekers' Allowance)
o Private Transfers of money from one individual to another
o Income that is not registered with the Inland Revenue (note here the effects of the Black or shadow economy where goods and services are exchanged but the value of these transactions is hidden from the authorities and therefore does not show up in the official statistics!)
iii) The Output Method
This measures the value of output produced by each of the productive sectors in the economy using the concept of value added. Value added is the increase in the value of a product at each successive stage of the production process. We use this approach to avoid the problems of double-counting the value of intermediate inputs. The main sectors of the economy are the service industries, manufacturing and construction, and extractive industries such as mining, oil together with agriculture
National Income Statistics
The following table shows the patterns and trends of GDP over 1990 to 2000.
Year
Real GDP
£ 'millions'
Population
'millions'
GDP per Head
'£ / Person'
990
659,171
57.238
1,516
991
650,085
57.439
1,318
992
651,566
57.563
1,319
993
667,804
57.673
1,579
994
698,915
57.797
2,092
995
719,176
57.928
2,415
996
738,046
58.043
2,716
997
763,459
58.167
3,125
998
785,777
58.305
3,477
999
804,713
58.481
3,760
2000
829,517
58.643
4,145
GDP Analysis6
Table 2
Over the years the GDP mean comes out to be £724,384 with a standard deviation of £64,762. Likewise GDP per head has a mean and standard deviation of £12496 and £1023 respectively (Supporting calculations are included in the appendices). On the other hand population has increased by 2.4% over the 10 years period.
Economists argue that national income statistics, in particular, GNP often scores highly (as a figure) on other measures of welfare, such as life expectancy. However, there are serious limitations to the usefulness of GNP as a measure of welfare:
* Measures of GNP typically exclude unpaid economic activity, most importantly domestic work such as childcare. This can lead to distortions; for example, a paid childminder's income will contribute to GNP, whereas an unpaid mother's time spent caring for her children will not, even though they are both carrying out the same economic activity.
* GNP takes no account of the inputs used to produce the output. For example, if everyone worked for twice the number of hours, then GNP might roughly double, but this does not necessarily mean that workers are better off as they would have less leisure time. Similarly, the impact of economic activity on the environment is not directly taken into account in calculating GNP.
* Comparison of GNP from one country to another may be distorted by movements in exchange rates. Measuring national income at purchasing power parity can help to overcome this problem.
Economic growth has made life considerably worse for people in Britain since 1955 7.A widely quoted recent estimate has claimed that for the past quarter century or so the Index of Sustainable Economic Welfare (ISEW) has been in absolute decline in the UK8.
By contrast, economic growth as measured by the UK national income accounts has been maintained throughout the postwar period at a steady if not spectacular rate with an average growth rate of real GDP/head at 2.5 per cent per year from 1950-73 and 1.8 per cent per year from 1973 to 19989
GDP is certainly not an adequate estimate of the level of sustainable economic welfare but this also applies to the ISEW adjustments to the national accounts, as critics have been quick to point out. ISEW has a number of features which make it unacceptable. In particular, the allowances that are made for environmental damage and depletion of natural capital lack a sound theoretical foundation, multiple-count the costs of climate change and exaggerate the value of reductions in energy reserves, while the adjustments made for changes to the distribution of income are not justified if the aim is to measure the economy's productive potential in terms of ability to provide future welfare (Neumayer, 1999).
Appendices
Supporting Calculations
GDP
Year
Real GDP
GDP per Head
£ 'millions'
'£ / Person'
990
659,171
1,516
991
650,085
1,318
992
651,566
1,319
993
667,804
1,579
994
698,915
2,092
995
719,176
2,415
996
738,046
2,716
997
763,459
3,125
998
785,777
3,477
999
804,713
3,760
2000
829,517
4,145
? x
7,968,229
37,462
? x
7,968,229
37,462
N
1
1
Mean
724384.455
2496.55
Population
Year
Population
'millions'
990
57.238
991
57.439
992
57.563
993
57.673
994
57.797
995
57.928
996
58.043
997
58.167
998
58.305
999
58.481
2000
58.643
Population increase
58.643 - 57.238
.405
.405
58.643
0.02395853
Population Increase
or 2.4 %
References
. Douthwaite, R. 1993, The Growth Illusion, Dublin, Lilliput Press, Pg 3
2. Economic History Service, what was the UK GDP then?
3. Jackson, T., Marks, N., Ralls, J. and S. Stymne, 1997, Sustainable Economic Welfare in the UK, 1950-1996, Guildford, Centre for Environmental Strategy.
4. Maddison, A., 2001, The World Economy, A Millennial Perspective, Paris, OECD.
5. Nicholas Crafts, August 2001, UK Real National Income, 1950-1998: Some Grounds for Optimism
6. The concepts and measurement of National Income, Yujiro Hayami
7. Biz/ed, http://www.bized.ac.uk
8. Measures of national income and output, http://en.wikipedia.org/wiki/Measures_of_national_income
Biz/ed
2 IBID 1
3 IBID 1
4 Measures of national income and output
5 The concepts and measurement of National Income, Yujiro Hayami
6 Source: Economic History Service
7 Douthwaite, 1993
8 Jackson et al., 1997
9 Maddison, 2001