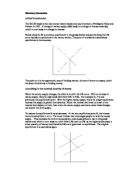
To restore the equilibrium RI must decrease. At the new equilibrium point B, the interest rate is lowered from r1 to r2. The lower interest rate encourages people to hold the excess supply. This increases the level of consumption, and causes prices to rise in the goods market and which in turn leads to a shift from LM2 back to LM1 as the higher prices imply a lower quantity of money and therefore LM curve goes back to equilibrium. The original equilibrium A is established again.
In conclusion a change in money supply has an exactly proportional change in price levels and no other real variable changes such as the real interest rate. This is in line with the theory of Neutrality of Money.
Increase in desire to invest
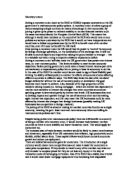
If the tastes, with regards to investment changes and the desire to invest increases at every rate of interest, this will have an effect on the Investment = Savings (IS) curve. For this to occur, savings need to increase at every rate of interest, or in other words savings are not affected by the interest rate but rather by levels of income. This means if savings are to increase the level of income needs to increase, thus shifting IS curve to the right from IS1 to IS2, creating a point of equilibrium at point B.
There is also a reduction in the real quantity of money – demand for money is a function of two variables (income and rate of interest). Income remains the same, but the rate of interest rises which resulted in the reduction of the quantity of money, shifts the LM1 curve to LM2. This brings you to point D, the new equilibrium, with a higher price level than before. The interest rate increases from r1 to r3 as do the prices, however the level of output remains constant at Y1. Savings also remain unchanged and the desire to increase investment is choked off by higher interest rates.
An increase in the willingness to work
The number of people willing to work is called the Labour Force. If the willingness to work increases, we would see an increase in the labour supply (LS). With more people working, the supply of labour exceeds the original demand for labour by producers. The SL1 curve will shift to SL2, moving equilibrium from point D to point E, thus causing a reduction in the real wage rate, from W/P1 to W/P2, as shown in figure 4.
The increase in the willingness to work will result in a higher level of output, from Y/P1 to Y/P2. This can be shown in figure 5 as labour increases from point L1 to L2.
The increase in output will also shift the AS1 curve to the AS2 curve, resulting in a level of output which has increased from Y/P1 to Y/P2. The change is shown in the IS-LM model below, figure 6 by a rightward shift of the AS1 curve to AS2. The increasing output and decreasing wage rate causes the price level to fall. A lower price means expenditure is decreased and therefore the money supply increases, the change causing the shift of the LM curve from LM1 to LM2. The effect on money supply is proportional to the change in price and therefore equilibrium is attained at E2. At the new equilibrium, real interest rates have fallen from r1 to r2.
Word Count 800