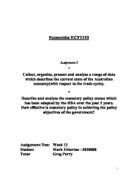
GDP, Chain Volume Measures: Trend
$ billion
|180
|160 |140
|120
|-----------------|------------------|------------------|-----------------|-----------------| 100
Jun Jun Jun Jun Jun Jun
1992 1994 1996 1998 2000 2002
Actual GDP figures in real $ values annual
1996-7 $575,950 (million)
1997-8 $601,614
- $633,723
1999-00 $659,002
2000-01 $672,232
2001-02 $697,607
$ Million
|725
|675 |625
|575
|-----------------|------------------|------------------|-----------------|-----------------| 525
1996-97 1997-98 1998-99 1999-00 2000-01 2001-02
Year
Employment and Unemployment
The Australian work force has had a number of differing factors affecting various sections of the work force. Employment growth has been particularly strong in construction and retail and wholesale trade, consistent in strength in dwelling investment and consumer spending. However, employment in the accommodation, cafes and restaurants sector have contracted over the year, reflecting subdued conditions in the tourism sector. The drought has impacted on the agricultural workforce and resulted in a marked decline in the number employed. Although a mixed bag of factors have been influencing the work force, there has been positive growth in employment and a nominal rate of unemployment has prevailed.
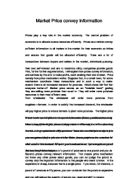
Unemployment levels since the early 1990’s has declined from a high of around 11% in 1992-93 to approximately 6.5% today. I believe this augers well for the Australian economy.
Unemployment rate, persons, annual average
%
| 11
| 10
| 9 | 8
| 7
|---------|--------|--------|--------|--------|---------|---------|--------|---------|--------| 6
1991-2 1993-4 1995-6 1997-8 1999-00 2001-02
Year
Residential Building approvals
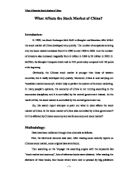
Residential building is a volatile segment of construction activity. It is sensitive to general economic conditions and shocks such as interest rate changes. Preceding the introduction of The New Tax System in July 2000, a substantial amount of construction activity was grought forward, peaking in December quarter 1999. A severe downturn followed this peak, but was quickly reversed by a combination of historically low interest rates, government incentives, mainly the first home owners grant and strong underlying demand for new dwellings. As economic conditions become more favourable, the housing sector is one of the first areas to strengthen as pent up demand becomes realized. Although there has been much propaganda in relation to the ‘Bubble Bursting” in the property market, there has yet to appear any significant signs of deflation. Low interest rates coupled with uncertainty with the share market has continued to blow this bubble.
The housing boom has assisted in counteracting the effects of negative factors on economic growth such as the decline in tourism due to terrorism and SARS along with the effect of the drought on agricultural yields.
Value of new residential building commencements trends
$ M
|7000
|6000 |5000
|4000
|-----------------|------------------|------------------|-----------------|-----------------| 3000
Jun Jun Jun Jun Jun Jun
1992 1994 1996 1998 2000 2002
Australian Cash/Interest rates
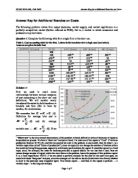
The reserve banks monetary policy appears to have been quite successful in keeping interest rates at a low level to ensure that there is economic growth whilst still keeping the inflation rate at a manageable level. The record low cash rate has remained unchanged at 4.75% for almost a full year ensuring that strong investment in the housing sector mainly, but also in industry continues. The Australian cash rate although low is relatively high in comparison to the international economy. This again would lend to the believe that the Australian economy remains solid amidst global uncertainty.
Australian Cash Rate
%
6 |
5 |
4 |
3 |
---M----J----S----D----M----J----S----D----M----J----S----D-- Quarters
2001 2002 2003
Sales of New Motor Vehicles
Sales of new motor vehicles is another factor which assists in reflecting the state of the economy. A significant part of consumer spending is the purchase of new motor vehicles and as such changes in new motor vehicle sales provide an indication of changes in consumer spending.
Sales of new motor vehicles rose from 616,256 in 1994, peaked at 807,669 in 1998, and subsequently declined to 772,681 in 2001. Since then there has been a fairly steady monthly climb in vehicle sales, with March 2003 seeing new vehicles rolling off the show room floors in numbers unprecedented, almost seventy three thousand new vehicles were registered in March. This also is a good sign as consumers, armed with good employment prospects and low interest rates are storming the dealerships.
Monthly trends all motor vehicle sales
February 2002 69401
March 2002 69134
February 2003 71460
March 2003 72907
$ Thousands/veh
2002 |73 2003 |72 |71
|70
|69
|-----------------|------------------|-----------------| 68
Jan Feb Mar April
Months
Consumer Price Index (CPI)
The Consumer Price Index has always been an important economic indicator and in recent years actions related to movements in the CPI have had direct or indirect effects on all Australians. The CPI rate has been used by the Reserve Bank of Australia in determining monetary policy, it is used to index Social Security and superannuation payments and in a range of business contracts for price adjustment.
The CPI assumes the purchase of a constant basket of goods and services and measures changes in the price of the goods and services in that basket alone. With the onset of war in the Middle East, oil prices rocketed, directly impacted on the CPI rate, this along with the effect of drought of frit and vegetable costs saw a rapid increase in CPI for a short period. Fortunately the war was short lived and oil prices were relaxed and there for the CPI rate returned to a level more accepting of the Reserve Banks Monetary Policy, which is in the realm of sub 4%pa.
Summary
I believe that the above figures indicate that the Australian economy remains robust, especially in comparison to other global markets. Although the housing boom should have run out of puff it is still providing a pillar of support for the economy. I have no doubt that the housing boom must be drawing toward the end of its stellar run, especially as historically it follows a five yearly cycle. Even so, given that there has not been soldi strength in over seas markets and the stock markets in particular, this run may continue, at what rate is any ones guess. One thing is for certain though and that is consumer debt is at an all time high, with low interest rates ensuring continued strong growth in household credit.
If inflation can be kept in check and interest rates remain stable, then the Australian economy, although it is not rocketing along, should continue its steady cycle.
The Monetary Policy stance of the Reserve Bank
The Reserve Bank of Australia’s monetary policy has been to keep Inflation in check at up to 4% per annum. To assist in this process the Reserve Bank adjusts the cash rate accordingly to either increase the ability to spend, or if need be to decrease the access to cash. This adjustment of the cash rate has been quite successful to date in ensuring the economy is flowing along steadily and not out of hand as it did in the late 1980’s when inflation germinated to a horrendous level. Since this time Government Policy has been implemented to assist in moderating this sort of behaviour.
As previously stated the cash rate has remained at 4.75% for some time and although the has been blossoming propaganda on occasions, especially in relation to increase in oil prices and the bubbling housing market, there has been countering factors which have moderated the impact of these factors. The Reserve Banks cash rate target is higher than the current rate, and although it is desirable to increase the rate towards the target, in doing this could seriously damage the economy.
Reflecting borrowing rates that are close to historical lows, businesses and households do not appear to be constrained to any significant degree by the cost and availability of credit. Credit to the household sector has been growing at an exceptionally fast rate, but borrowing by businesses has been more subdued, even though profits have generally bee healthy and they appear to have ample funding available for their investment plans. Over all the Reserve Bank believes that conditions in Australian financial markets continue to be supportive of growth in spending and activity.
Even though the Australian dollar has been appreciating, and this can impact on the export market, the dollar has been quite subdued and is appreciating from a fairly low base so the impact should be nominal at this stage.
I consider that the Reserve Bank Monetary policy has been quite successful over the last couple of years, as the Australian Economy has fared well considering this time of global uncertainly, not to mention that I have a number of home loans and appreciate the affordability and option of low fixed rate terms.
Reference List
1. ECU ‘Economics 1’, guide, pages 78, 79, 80.
2. Gans Joshua, King Stephen, Stonecash Robin, “Principles of Economics”. 2000, Ch. 17, pages 366 to 379. Harcourt. Australia.
3. Australia Bureau of Statistics internet site address
4. Hobbs, Dr Brad, Florida Gulf Coast University – Economics internet entry. 2002, site address
.
5. Reserve Bank of Australia internet site address
6. Australian Financial Review internet site address