Transport - The movement of goods and people from one destination to another for a variety of personal and business purposes
TRANSPORT
* The movement of goods and people from one destination to another for a variety of personal and business purposes
* Measured in tonne/passenger kilometres or number of journeys.
* Derived Demand = not demanded for its own sake but for the need to transfer goods or passengers - dependent on the demand for these
* Can't be stored or transferred
* Affected by peak & off-peak demand (daily & seasonal)
* Supply/capital is indivisible - public transport can be at full capacity into an urban area at peak time, but empty on return journey = over supply at off-peak times.
* Continuously changing (passengers & freight)
* Generates negative externalities
* Accounts for 15% of GNP
Demand influenced by-
* Own price (buying and running)
* Price and quality of substitutes
* Price of complements
* Output
* Income (transport in general & particular mode of transport chosen) - travel expenditure increases with income, yet bus & coach fare expenditure decreases with income (inferior goods).
* Journey requirements (e.g. employment & personal needs)
* Leisure time (increasing = more holidays & further afield)
* Changing urban structure (e.g. places of entertainment built out-of-town)
* Personal preferences
Forecasting Demand for Future Traffic
* difficult process as it depends on how the variables affecting demand change over time, & economic growth.
* essential for the government who has to decide on the allocation of funds for future development.
* important in assessing whether the benefits from an improvement, over its life-time, justify the initial cost - enable a balance to be struck between providing extra capacity before it is needed & the cost of adding to capacity at a later stage.
* to predict the environmental impacts of traffic
952 - 27% of passenger km travelled were by car, taxi, van, & 60% public transport (bus & rail)
2000 - 86% of passenger km travel by car, taxi, van; & only 12% public transport
Car Transport
Dominates passenger transport (86%) & is increasing because -
* Cost has risen less than bus & rail fares
* Rise in incomes - high income elasticity of demand, as it's most flexible, comfortable & convenient (15% household expenditure - approx £52)
* Increase in car orientation of society - more likely to drive than walk or cycle (due to safety?)
* More household members own a car rather than sharing
* Used for short journeys and for more purposes, e.g. shopping in bulk
* Complement for increased leisure time activities
* Demand is price inelastic
Bus Transport
Important form of public transport but number of journeys have declined due to -
* Rise in real incomes - perceived as an inferior good which providing low quality service
* Rise in price of fares (in comparison to rise of cost of using a car)
* Increase in length of journeys undertaken - people are more likely to undertake long journeys by rail, car or coach because of greater speed & comfort
Negative externalities produced by road transport -
* Pollution - air, noise & visual
* Accidents - imposing high costs on society, e.g. loss of output & use of health service resources
* Damage to buildings - by pollution & vibrations
* Destruction of wildlife
* Congestion
Currently, vehicle owners only pay taxes such as petrol tax, to the government to pay for these externalities & maintain roads.
Congestion
* When the actual journey time taken is longer than the normal expected time because of the addition of more road vehicles onto a road network reducing the speed of which vehicles can travel.
* Demand for road space grows more rapidly than supply
* Not self-correcting - speeding up the flow of traffic will generate a higher demand
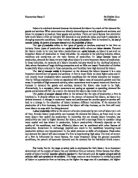
Speed-flow curve
Point A = max efficiency for individual as speed is at highest (free-flow situation - little or no interaction between vehicles).
As extra vehicles join, average speed is reduced but an increased flow still occurs, until point B is reached.
Point B = max efficiency for whole system as max flow is achieved.
Motorists continue to enter the road after point B because they lack perfect information, thus slowing the whole flow.
Point C = speed-flow situation during peak period.
Costs
* Hinders places from attracting people & business
* Increased commuter times
* Reduced productivity of vehicles (i.e. they carry a lower volume of goods or passengers per hour)
* Delays in delivery of goods
* Higher costs to firms passed onto consumers in form of higher prices - reducing international price competitiveness
* Increased fuel & vehicle costs
* Opportunity cost
* Pollution
* Accidents & Stress-related illnesses - reduce output & increase demand on health service resources
* Road rage
* Market Failure - Inefficient
"Every British household has to spend at least £10 per week more than it needs to on goods and services in order to meet the costs to businesses of congestion."
"Delays on the M25 cost £1 billion a year."
"Total congestion costs equalled £19 billion in 1997."
"By 2025, traffic levels are expected to be between 36% & 57% higher than in 1997." CBI
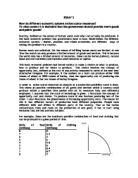
D1 refers to off-peak AD for route. If cost per trip is C0 & demand is D1, then this will produce a flow of F0 along the route.
The diagram assumes that congestion is the only externality; hence MPC is equal to MSC for traffic flow up to F1 because there's no congestion until that flow is reached.
At flows above F1, congestion occurs as additional drivers slow down the overall traffic flow & the individual's MPC per trip increases. Each motorist begins to interfere with other road users, affecting their costs. So there is a divergence between MPC & MSC (MPC1 & MSC1) - MSC is equal to MPC plus the social cost of congestion.
If demand for route at peak period is D2 then traffic flow will be F2. Here F2B will be the private cost (to the individual), and the external costs that the motorist hasn't taken into account will be ...
This is a preview of the whole essay
At flows above F1, congestion occurs as additional drivers slow down the overall traffic flow & the individual's MPC per trip increases. Each motorist begins to interfere with other road users, affecting their costs. So there is a divergence between MPC & MSC (MPC1 & MSC1) - MSC is equal to MPC plus the social cost of congestion.
If demand for route at peak period is D2 then traffic flow will be F2. Here F2B will be the private cost (to the individual), and the external costs that the motorist hasn't taken into account will be equal to AB.
At flow of F2 there is allocative inefficiency, as the social cost of congestion has not been accounted for by the private motorist.
Demand policies for congestion
Road pricing- meters attached to cars activated by sensors on road when congested & a charge then registered, or tolls.
- users pay the costs they impose on others (externalities)
- dissuades marginal car user from using road
- provides revenue to construct more roads & improve public transport
- priced like any other resource (not taxed)
- produce an economically efficient allocation of resources
- removes market imperfections
- will increase inflation rate
- need to make accurate estimates of elasticities of demand and MSC (for charge)
- identification of costs - difficult to measure marginal costs when there is no standard use of road (used by different consumers, in different modes, at different times)
- fails to distinguish between income levels (penalises those who have to travel at peak times, forcing poor off roads = redistributive effects)
- may lead to further distortions in the market
- expensive and takes time to implement
- tolls would create further congestion
- may encourage drivers to use alternative routes, shifting the problem
- invasion of privacy??
- contentious issue
Bristol & Leeds hope to introduce road pricing in 2004
By placing a charge of CD on the road user, so raising MPC1 to equal MSC1, this will reduce the traffic flow from F2 to F3 = more efficient allocation as MPB (D2) is now equal to MSC.
Price must be equal to marginal cost of producing it since the benefit to the individual of consuming the last unit will equal the opportunity cost to society of producing that last unit.
Assuming that road space is in unlimited supply & is provided free to users, consumers will demand Q0 at zero price = market equilibrium.
Qc shows that the road has capacity & a limited supply, MPC is drawn up from this & equilibrium is now at E', where MPC = MSB (motorists are only paying private costs).
The social costs of congestion exceed the private costs - MSC is above MPC. Social optimum = E" = demand is less (Qp to Qs) & price is higher (P1 to P2)
E"T = road price.
Licences - vehicle owner purchases & displays a license when travelling into a designated area, or ERP (Electronic Road Pricing)
- users are sensitive to fiscal penalty
- inflexible
- labour intensive
Introduced in Singapore in 1975.
Shifts demand curve D2 to the left, thus reducing the traffic flow towards F1
Subsidising Public Transport
- improvement in public transport
- finance
- persuading car owners to transfer from private to public transport
- public sector aimed at young & elderly who have lower incomes (small market)
- car owners not paying for negative externalities
Shifts demand curve to left
Parking restrictions - parking meters & restrictions on on-street parking, thus limiting supply of parking spaces and reducing demand for car usage on certain routes.
- encourages shoppers, increasing business
- encourages out-of-town parking and park-and-ride schemes
- pedestrian-only zones (safety)
- removing parking facilities increases size of road and may encourage extra traffic flow
- parking charges are unable to discriminate between length of journey & route taken
- encourages illegal parking adding to congestion
- lack of control over privately owned car-parks (license? - charging people to park at work, reducing the number of free workplace spaces available so reducing car journeys and promoting use of alternative modes)
- wheel clamps & tow away system
Operates in Oxford, Cambridge & York
Limiting car use and ownership
* Limit on car ownership - imposing import restrictions, registration tax or rationing of cars
* Car sharing
* Increase in price of fuel
- saves energy
- reduces CO2 emissions
- can tax heavy vehicles & fuel-inefficient firms more
- disadvantages to car industry
Supply policies for congestion
Increasing number of lanes & building new roads
Shifts MPC1 & MSC1 to MPC2 & MSC2
Before road capacity was expanded, congestion occurred beyond traffic flow of F1 but now occurs at a point beyond F4 because an increased flow is possible before the costs of congestion appear. If demand is D2, then a flow of F5 will now use the road & although there will be some congestion (MSC2 is greater than MPC2 at F5 by GH) this will be less than before the new road expansion (AB).
Demand could be underestimated and be almost perfectly elastic (D3), so the flow of traffic along a particular route would be F6 not F5, & the social cost which had not been taken into account would be EF not GH. So a similar congestion problem still persists.
- Road expansion may encourage more users, especially those who previously used public transport - so new traffic is generated
Government Transport Policy
* Improve public transport
* Reduce car dependency
* Increase personal choice by improving the alternatives
* Sustainability
* Create an improved integrated transport system to tackle congestion & pollution
* Allocation of £180 billion for 2001-2011
* Increased taxes of around £1 billion by 2005
* £300m of new public investment to kick start private sector investment
Integration with -
* & between different types of transport - so each contributes its full potential & people & freight can move easily between them
* environment - so transport choices support a better environment
* land use planning - to reduce need to travel
* policies for health, education & wealth - so transport helps to make a fairer society
Quality
Road Traffic Act - bus operators & freight hauliers must license their vehicles, as capital costs of vehicle purchase are low, so there is a low barrier to entry into the industry. Profits are driven down & this could lead to operators reducing their costs, affecting safety standards.
Quantity
Licensing - to ensure existing capacity was fully utilized.
Cross-subsidization of bus services - off-peak journeys are socially worthwhile but unprofitable, but supported by profits made at peak times. - only possible as long as operators have monopolies (less likely with a deregulated bus industry).
Ownership
Railways, parts of road haulage & bus sector are under public ownership as it would be easier for the government rather than private companies to subsidise & co-ordinate them.
Contestable markets
Privatise & deregulate transport markets
Increased competition = decrease in price
No supernormal profits
Must be efficient to keep franchise
e.g. only one train company may operate a route but the market can be made contestable by selling it a short-term franchise which will only be renewed if the service it provides is of a better quality and lower price than that which could be offered by other companies.
e.g. bus service - if profits rise on a particular route bus companies operating on other routes may switch some of their fleet to the profitable route.
Consumers may reap double benefits from contestable markets. They may be able to benefit from the lower costs which a sole firm can gain because of economies of scale while also benefiting from the absence of supernormal profits because of the possibility of entry of competitors into the market.
Mergers may reduce the number of potential competitors, restrictive practices may occur & consumers may not benefit if there are significant negative externalities.
Sustainable Transport Policy
* Meets the current needs of people & firms without threatening the environment & the ability to meet the transport needs of future generations.
* Takes into account social costs & benefits (wants to make the social costs of transport equal to private costs)
* Discourages the use of the car & promotes other environmentally friendly modes of transport
* Co-ordinated with a range of other policies, including health, education, environment & land use planning.
* Improve fuel efficiency (new fiscal measures that make fuel more expensive & which tax more heavily those vehicles which are heavy users of fuel; and promote research for more environmentally friendly fuel).
* Reduce the rate of growth of future demand for transport use, especially road transport
* Make greater use of rail, for passengers & freight
Private Road Construction (e.g. Birmingham northern relief road)
Private sector companies can design, build, finance & operate privately financed road schemes = more roads built than if only funded by government. Higher quality roads (with more care would be taken to ensure projects are completed on time & within financial constraints), because private road builders would be using their own finance & bear the risk of financial failure. Only built if construction company thought demand was sufficient to generate an adequate return on capital investment. Charging to use roads would ensure users paid directly for the resources they consumed. Private sector are likely to only be attracted to parts of country experiencing higher levels of economic growth.
Shadow toll = where the private construction company makes an agreement to build or improve a road & is then reimbursed by the government, depending on the number of vehicles which use the road. Benefit = avoids disruption of traffic flow caused by collection of actual tolls.
Bus Deregulation
Deregulation = the removal of government regulations & restrictions which act as barriers to entry & exit from a market, protecting the public sector. Creating a contestable market with greater potential competition.
In the transport market, the government may prohibit other firms competing with a sole provider or may limit entry by giving out only a few licenses to operate a particular route.
Before 1930 = competitive market structure with no government regulations which led to-
* fierce competition between rival bus companies,
* lots of accidents,
* unscheduled intervention by 'pirate' operators at peak times
* other types of wasteful duplication
Due to this, Bus Regulation & Road Traffic Act were introduced -
* issue licenses to act as barrier to entry
* improve quality of vehicles
* control level of fares
* operator had a monopoly on a particular route
But rising operating costs, rising fares, increase in use of car = decline in usage, so Transport Act was abolished.
Benefits from deregulation -
* increased competition allowing greater choice for consumers
* greater pressure to be competitive
* closer relationship between bus operating costs and fares charged, (ending cross-subsidization where certain routes were overcharged to subsidise non-profitable routes)
* freedom of entry for new operators, competing away any monopoly profits from charging excessive fares on routes, unrelated to costs.
* Greater potential for innovation
* Reduction in subsidies obtained by bus operators
Problems of deregulation -
* Wasteful duplication of services = congestion
* Neglect of other routes
* Reduction in subsidies could lead to increased fares
* Increased market concentration
* Development of 'bus wars'
* Doesn't increase welfare
Bus services since deregulation -
* Increase in annual bus kilometres travelled (may be misleading)
* Decline in provision of local bus services
* Decline in rural & off-peak services.
* Decrease in passenger journeys due to -
o Confusion to passengers due to changes in service times, routes & operators
o Increase in fares (more than the rate of inflation) (due to reduction in subsidies)
* Bus wars - 2 companies racing from bus stop to bus stop on a busy route competing for customers = safety risks & less frequented stops missed out in order to reach more popular stops before rivals.
* Partnership between bus operators & local authority = traffic management schemes, bus lanes & park&ride
* Investment = improved services
* Competition has been variable - intense on some routes, none on others
* Reduced subsidy
* Fares are higher & rising at a faster rate than the cost of using a car.
The deregulation of long distance coach services has been successful.
* Commercially run
* Council subsidised from money raised from public taxation
Easy to subsidise cheap routes, which have a large social benefit, but as the number of routes subsidised increases, the amount of money required increases. At some point, the cost of obtaining this money through taxation will outweigh the benefits to society, & some routes will go unsubsidised.
Solution = Cross-subsidisation but this requires pricing above marginal cost on routes where possible, reduced allocatively efficiency & doesn't encourage a competitive market.
2 options = allow a competitive market subsidising where necessary (but no integration so few network benefits)
or operate as a single network with a single grant (prices above marginal cost on all routes by an amount varying with demand elasticity).
Franchising = removing competition in the market & replacing it with competition for the market - ensures that the company operating the services did so at the lowest possible cost.
The right to operate a particular service over a stated length of time, with or without public sector subsidy
BR Privatisation
Privatisation = a way of improving the quality of public transport by moving it from the public to the private sector, opening up a greater amount of competition.
Objective of privatisation of BR was to:
"Improve the quality of railway services by creating many new opportunities for private sector involvement"
BR was split into 4 & Railtrack was established to -
* own & manage railway infrastructure,
* timetable services
* ensure safety standards
* invest/modernise infrastructure
Railtrack's revenue comes from charging users of the track & from leasing stations.
Railtrack is a natural monopoly - an industry that has to be run as a monopoly to take full advantage of the economies of scale on offer. It would be inefficient & impractical to have a number of separate firms being responsible for provision & maintenance of track.
The government appointed a regulator, ORR, to ensure that Railtrack does not exploit its market power
Objectives -
* Promote the interests of passengers
* Promote the development of rail freight
* Bring together passenger & freight interests
* Ensure Railtrack operates, maintains, renews & develops network to provide improvements expected
* Promote better integration
* Promote competitive structures & control monopoly to protect & benefit users
* Ensure that regulated contracts & licenses operate, develop & improve
* Increase rail freight by giving grants
Benefits from Privatisation -
* Allow greater amount of competition - improving efficiency & quality of service
* More efficient use of resources
* Higher quality
* Lower prices
* More choice
* Encourages additional investment from the private sector
* Subsidies can continue but be reduced
* Privatised sector allowed companies such as bus companies to run rail services - creating attractive opportunities as they have similar skills in running public transport services and have considerable market knowledge.
* More concern for customer needs - employees more motivated
Results from BR Privatisation
* BR was slow to change and take advantages of new ideas.
* Potential franchises have been deterred from entering the rail sector
* It increased rather than reduced the level of bureaucracy
* It caused deterioration in punctuality and reliability.
* Passenger complaints almost doubled when first privatised.
* Public lost confidence in rail travel
* Growth in rail freight
Arguments for Public transport to remain in state ownership -
* More likely to base its decisions on social costs & benefits whereas the prime motive for the private sector is profit
* It's in a natural monopoly position with other suppliers prevented from entering the market through legislation, therefore benefiting consumers through economies of scale
* It's in a better position to integrate different transport modes
* It can help the poor by subsidising public transport to keep fares low (equity)
* It can guarantee supply at an affordable price.
Why Privatise & Deregulate?
* To reduce government involvement - return to market forces to achieve an efficient allocation of resources
* To cut back on public expenditure
* Break down barriers that protected the public sector monopolies from competition
Investment = the production of goods that are not for immediate consumption, it increases the stock of capital in an economy.
In the transport infrastructure it is -
* Long-term
* Expensive
* Generates positive & negative externalities
* An important form of capital expenditure by central & local governments
Capital Expenditure = money expended by the central & local governments, spread over various years
Current Expenditure = money expended by the central & local governments on items such as annual maintenance costs & revenue support (fares subsidies).
In a market, different segments are likely to have different price elasticities of demand.
Price discrimination = total revenue will be maximised if marginal revenues are equalized across all market segments. Prices are then set in accordance with the price elasticity of demand in each segment. The more inelastic the demand, the higher the price.
Where price elasticity of demand is estimated at less than unity, high prices are charged e.g. morning commuters
Where price elasticity of demand is estimated at greater than unity, lower fares are offered.
In market segments most sensitive to price (where competition from other modes is most strongest & customers may be less well off) further discounts are given.
Subsidies can help to reduce the prices paid by passengers, & to boost patronage on the services concerned. They generate social benefits.
The receipt of subsidy by transport operators shifts the supply curve to the right so output is offered at a reduced price.
* Social equity - subsidised fare
* Generates positive externalities
* Encourages use of public transport
* Helps urban regeneration
* Difficult to direct the subsidy to those who really need it e.g. commuters pay the same rail fares, regardless of income.
* Causes inefficiency
* Lacks motivation to keep costs down
Denationalisation = a change in ownership from public to private sector
Cross-subsidisation = internal to the business, where profits earned on one part of an operation are used to support loss-making services = a network of services provided rather than just those that earn profit.
Inefficient - leads to higher costs & fares in some areas, yet lower costs in other area, though not passed onto passengers through lower fares.
VED is an annual charge that has to be paid by all vehicles using the public highway. Historically it has been set at a flat rate for private cars & at a variable rate for commercial vehicles, depending on their weight. A more sustainable outcome would be to vary the rate of VED depending on the vehicle's engine.
Mode Comparison
Passengers
Freight
Mode
Advantages
Disadvantages
Advantages
Disadvantages
Rail
Ø Fast
Ø Work while travel
Ø Carry a lot of people
Ø Environmentally acceptable
Ø Expensive
Ø Delays
Ø Not door to door
Ø Frequency
Ø Direct
Ø Large capacity
Ø Fast
Ø Additional method needed
Private car
Ø Flexible & convenient
Ø Comfort
Ø Door to door
Ø Cheaper than trains
Ø Congestion
Ø Pollution
Ø Fuel prices
Ø Safety
Possibly van
Ø Convenient
Ø Door to door
Ø Not much room to carry large amounts
Ø Not environmentally friendly
Public bus
Ø Cheap on average cost
Ø Bus lanes
Ø No parking
Ø Not always reliable & comfortable
Ø Congestion
Ø Not necessarily direct
Ø Connection
Ø
Ø
Inland waterways
Ø No congestion
Ø Cheap
Ø Environmentally friendly
Ø No tax
Ø SLOW
Ø Large loads
Ø Lower production costs
Ø Cheap
Ø Not a network of canals
Ø SLOW
Ø Additional modes needed
Air
Ø Long distances fast
Ø Comfort
Ø Carry reasonable amount
Ø Opportunity cost
Ø Expensive
Ø Limited airports
Ø Time delays
Ø Congestion
Ø Not environmentally friendly
Ø Quick - good for perishables
Ø Expensive
Ø Can't carry huge load
Ø Additional transport needed
Sea
Ø Large people carrying
Ø Relatively cheap
Ø Environmentally friendly
Ø Slow
Ø Weather
Ø Large quantity
Ø Fairly cheap
Ø Extra cost via port
Ø Slow