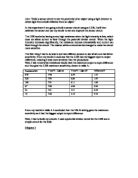
Next, I had to test which resistance would have the maximum output to input difference and thus give the LDR maximum sensitivity, shown in table A:
From my results in table A I concluded that the 10k Ω setting gave the maximum sensitivity as it had the biggest output to input difference.
Next, I had to build my circuits. I used a potential divider circuit for the LDR and a simple circuit for the bulb:
Diagram 1
For my final circuit design I used an ‘orange power pack’ connected to a bulb with a clamp holding the bulb in place for the simple circuit.
The LDR was fixed onto a block of wood so it was level with the bulb. A wooden block was also set between the bulb and LDR to stop light being detected directly from the bulb to the LDR. A wooden board was also used as the object that I would measure the proximity of. A one metre scale was measured out and the board was moved 0.05m for each measurement from 1m down to 0.15m. The Vout was recorded at each point on the scale. The experiment was carried out in a dark room. These are diagrams for the above description:
Diagram 2
Diagram 3
My final calibration results are shown in table B:
I then drew a graph of my results:
Graph 1
Vout/v
Distance/m
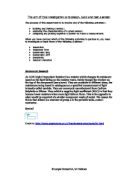
I then used Graph 1 to test my sensor by placing the object at random positions on the table within my range and using the graph to try and work out what it’s distance was. The results are shown in table C:
From this I worked out the percentage error was from 0% to 10%.
From my data I could see that the error varies with distance. This could be because of the LDR’s limited sensitivity when light is reflected from longer lengths. This means that the percentage error increases with distance. To test this systematic error, I could calibrate the sensor for longer lengths, then test it and compare the percentage error to my first results.
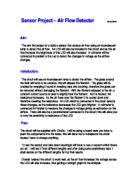
The effective range of my sensor is around 0.15m to 0.60m.
Important properties of a sensor are good sensitivity resolution, rapid response time, small random and systematic errors.
A sensors response time is the time it takes a sensor to respond to a change in it’s input.
Random error could be caused by a fluctuation in the input or from noise generated by the sensor, these errors are always present in experimental data.
Systematic errors occur due to disturbing influences usually from the environment around the sensor and are not easily detected.