Method – step by step
- Put on safety goggles
- Collect all the equipment that is needed as shown in apparatus list above
- Boil water in kettle.
- Wrap a piece of insulating material around copper beaker once and secure with elastic bands.
- Pour 100ml of boiled water into measuring cylinder
- Fill beaker with boiling water.
- Place thermometer in water and wait for temperature to reach 70 degrees.
- After 3 minutes record temperature off thermometer.
- Take temperature recordings at 3 minute intervals for 15 minutes.
- Repeat all steps for each insulating material.
Prediction
Insulators are very poor conductors. When they are wrapped around hot objects, they work by acting as a barrier, reducing heat loss.
I predict that these factors will effect the efficiency of the material.
· Colour
· Thickness
· Density
The lighter the material in colour the better insulator it will be. I predict this because light colours are poor radiators, therefore they will reflect the heat back into the copper beaker. The darker materials will absorb the heat and release it into the surroundings so will not be as effective at insulating the beaker.
The thickness and density of the material will also have a significant effect on the materials efficiency. Air is a very poor conductor, so materials with lots of large air pockets will be good insulators. For the material to have lots of air pockets it has to be less dense and quite thick. The air trapped in the pockets will prevent convection currents and trap warm air. These factors will help to reduce heat loss. A poor insulator will be thin with small if any air pockets, allowing heat convection and conduction increasing heat loss rapidly.
I can use this knowledge to predict that carpet will be the most effective insulator. It has small pockets of trapped air to capture and conserve heat, and is a light colour, so willreflect heat back into the beaker. It is also the thickest of all the materials. Because newspaper is the thinnest and darkest material, I predict that it will be the least effective at reducing heat loss.
To make sure the experiment is a fair test, and to achieve accurate results, the following factors must be controlled:
-
Volume of water used - When the volume of water is higher, it will stay warmer for longer than if there was a low volume of water. This is because when there is a high volume of water then the outside of the water will cool down, but the inside will stay warm. This will be kept constant at 100ml in each beaker. A measuring beaker will be used so that this can be kept constant throughout the experiment.
- Temperature – Recording will start when the temperature of the water has reached 70 degrees c. A thermometer will be used to measure the temperature accurately.
- Time – Recordings of temperature will be taken at 3 minute intervals for 15 minutes. A stopwatch will be used to ensure that time is measured accurately.
-
Insulating material – Each material will be wrapped around the beaker only once. Although the materials might be different in thickness etc. it is important that they cover the same area.
Safety
I will take a number of safety precautions whilst conducting the investigation. I will ensure the kettle is used safely through out the experiment, and hot water is transferred securely. I will take extra care when handling the boiling tubes when the hot water is present.
Evidence
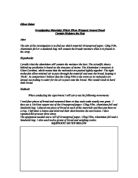
Graph to show temperature of water in beakers insulated with different materials
Analysis
My results state clearly that the best insulator material was the carpet. This suggests that my prediction was correct, as I thought that carpet would be the most effective insulator because of its air pockets that trap and conserve heat. All of the materials erduced heat loss by a small amount, and the graph above shows that although most of the materials had similar results, carpet was the most effective insulator. The reason that the results were so similar may have been because I did not seal the beakers with lids, therefore not preventing heat loss from the top of the beaker.
The most inefficient insulator was the newspaper. I predicted that this would be the least effective material for reducing heat loss, because it is thin, and its dark colour means that it will abosrb heat and release it into the surroundings. The results suggest that my prediction was correct.
When comparing the results of the insulating materials to those of the control, we can see that the carpet is the most efficient material for reducing heat loss. The yellow line is the highest on the graph, suggesting that my original prediction was correct. The black line on the graph shows that newspaper was the least effective insulator, as it is closest to the results of the non-insulated material. All of the lines on the graph follow the same decending trend, showing that their were no anomilies in the results.
The thickest material (carpet) was the most effective insulator, and the next thickest (bubble wrap) was the second most effective. This pattern is consistent throughout all of the materials, so in conclusion we know that the thickness of the material is the main factor that affects its effectiveness in reducing heat loss. Also, if a material has small air pockets, this also makes it a good insulator as it can trap and conserve heat. This is why tightly woven materials are not as effective at reducing heat loss.
Evaluation
The method I chose to use was successful and worked well within the investigation, it was reliable and fair. My results clearly showed how the three factors I predicted effected the materials efficiency. It also showed to what extent the factors effected the efficiency of the insulator, and showed that the thickness of the material had the most substantial effect. I concluded that the best insulator was the carpet material. I think my results achieved my aim and matched my prediction. No mistakes were made and therfore the results show no anomilies. This is because time, volume and temperature were all measured, recorded and checked to avoid errors. We did not repeat the procedure for any of the materials as we felt that the results were clear and precise enough to dra\w conclusions from.
The results of the experiment showed that the thickness of the insulator is the most important factor that effects the reduction of heat loss. The results for each material are very similar, and these could have been defined by using a wider time scale to see how effectively heat loss was reduced over a longer period of time. If I were to repeat the experiment I would also do the experiment twice in order to test the reliability of my results against another set of evidence.
As an improvement to my experiment I could have put a corkboard underneath the copper container, as this will have reduced the conduction of heat from the copper container into the table. Also, the position in which the thermometer was in could have affected the rsults, as the water is warmer in the middle. I could have used a clampnd to hold the thermometer in a fixed position; by doing this I could ensure that the thermometer is always at the same place in the water. These things would have kept my experiment much fairer.
Another factor which could have effected my results was that I did not seal the copper beakers with lids. Warm air rises, and this means that heat would have escaped from the top of the beakers, therefore not giving accurate results. If I were to repeat the experiment I would seal the copper beakers with lids, therefore preventing heat loss from the top of the beakers. This may show a larger difference between the results for each material.
If I conducted the experiment again I would use a wider variety of materials with a wider range of colours. I would want to do this because then I could investigate further into how the colour of the material effects my results. I would use the same material but in different colours for each test. I would also use the same colour material but in different textures e.g. woven pleated, platted, knitted etc. This would enable a more accurate evaluation of results.
To provide additional and relevant evidence for furthur investigations, any of the current variables could be changed. For example, the time scale used in this experiment could be extended, or recordings taken from a wider range of temperatures e.g. recordings could have begun from 10 degrees c. Different materials could also be used for different results.
Sources used:
- Key science Physics
- www.homeworkhigh.com