A F U Y
Procedure:
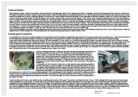
A tensile load is applied to each specimen and this is increased until the specimen fails. As each specimen is tested a real – time graph, indicating the load being applied and the extension of the test piece is produced.
When performing the experiment, the entire specimen used was fixed to the machine. Then it was inserted in to the upper jaws of the testing machine and was secured. On the testing machine the load scale was adjusted to zero as necessary. After that the lower jaws of the testing machine were set to engage with the specimen
Then the machine started and the material started to extend due to the applied loads. The graph then showed an excellent linear variation of the extension with the increment of the load up to points similarly as shown on graph 1. This indicates the portion of the curve, where the metal deforms elastically. (Elastic deformation is recoverable after the load is removed. Plastic deformation is not recoverable). After this point the deformation is more plastic and there is a relatively large extension for a small change in the load. Once the specimen reaches its ultimate tensile strength it will then reach its failure point and break, normally with a cracking sound.
The above procedure occurred to all 4 samples, however only tensile/ yield testing will be carried out to samples A and F in the results section.
This is due to the fact that ductile materials other than steel typically do not have a well defined yield point. For these materials the yield strength is typically defined by the 0.2% offset strain. The yield strength at 0.2% offset is determined by finding the intersection of the stress strain curve with a line parallel to the initial slop of the curve and which intercepts the abscissa at 0.002. However this will not be conducted in this experiment. 2
Results:
The stress at the point on a stress / strain curve where the deformation becomes noticeable is called the Yield Stress. The stress obtained at the highest applied force is called the tensile strength. The elongation and reduction provides an indication of how ductile the material is. 3
- Tensile Strength
The tensile strength is described as the stress which is obtained at the highest applied force. This is usually the point at which the necking begins in ductile materials. The breaking strength is the stress required to break a material.
As continually higher strains are applied to a material, the material will eventually fracture. At this point, the material’s cross-sectional area begins to decrease along a localized region in a process known as necking. All successive deformation occurs at this neck.
I have noted the results in the table below. Largest source of uncertainty in making measurements of tensile strength from the stress-strain curves was in reading the relevant value off of the graph. I have made the assumption that the points on the graph are to half of the smallest division.
A ; 8000N divided by 20mm2 = 400
F; 11,250N divided by 10mm2 = 1125
* All results in N/mm2
- Yield Strength
The Yield stress is the stress at which plastic deformation is likely to become more apparent. The yield stress in steel for example is at that stress at which the steel no longer behaves elastically and suffers irrecoverable elongation. If the yield strength is exceeded the object will be permanently deformed and likely will be no longer useful.4
The largest source of uncertainty in making measurements of yield strength from the stress-strain curves is in reading the relevant value off of the graph.
A; 8,400N divided by 20mm2 = 420
F; 10,450N divided by 10mm2 = 1,045
Samples After the Test
Analysis of Results
In the calculation of breaking or tensile strength, the original cross section area was used (this is known as the nominal stress or the engineering stress).
My initial assumption of samples Y and U being based on the same metal aluminum and A, F both based on steel, have resulted in 2 very different results. I would have initially thought that the pair of metals would have acted quiet similar to one another however it wasn’t the case. U results varied widely to that of Y and so is the case with metals A and F.
- Metal samples A and F
Now as established earlier two materials contain carbon, the steel with carbon content, samples A and F.
Most steel contains less than 0.35 percent carbon. Plain carbon steels can be grouped into 3 categories;
- Mild steel = 0.10 to 0.25% Carbon
- Medium carbon steel = 0.25 to 0.5% Carbon
- High Carbon steel = 0.50 to 1.5% Carbon
* Thus sample A is mild steel and F is a high carbon content steel
Carbon is very special because it can form so many compounds. The explanation lies inside the carbon atom. Carbon atoms can form strong links with four other atoms. This increases the number of patterns that carbon atoms can make. Carbon can also link together in long chains or rings, with carbon to carbon. 5
Steel properties show that it is a stiff material, which is good because it means that steel can withstand large forces. Which is why steel is used in car manufacturing due to its ductile properties - which means it deforms before fracture. This property is especially useful if a car gets into an accident.
Generally, carbon is the most important commercial steel alloy. Increasing carbon content increases hardness and strength and improves harden ability. But carbon also increases brittleness and reduces welding ability because of its tendency to form marten site. This means carbon content can be both a blessing and a curse when it comes to steel. Thus due to this my initial assumption is that sample F will be stronger than sample A, but A will be more ductile, due to F containing more carbon. 6
Looking at the results graph, sample A, you can see where the linear region ends and where the plastic deformation begins. The linear region is quite long and the slope is steep which indicates that the Young modulus is high; this is expected from a material such as steel because of its ductile properties. When the steel passers the linear region it deforms permanently. This is because some of the atoms slide over each other; this is called plastic flow which occurs after the yield point. Forces that take steel above the yield point break bonds between atoms and rearrange them. Once the force is removed, the atoms are unable to return to their original positions. Plastic deformation absorbs energy, some of this energy is used to break bonds, and some is used to raise the temperature of steel as the atoms slide over each other. After the yield point, steel and many other ductile materials will undergo a period of strain hardening, in which the stress increases again with increasing strain up to the ultimate strength. This can be evident on the results graph.7
Judging from my initial assumption I was correct in estimating that sample F would be stronger than sample A, and sample A being more ductile. Sample F had a higher yield and tensile strength.
The tensile strength of the materials showed that sample F was stronger than A as it had the highest value, which meant a greater force is required to deform the material. The breaking strength is an ideal way to compare different materials. A strong material has a high breaking strength; a weak material has a low breaking strength. From the table it is clear to see that sample F is the strongest material, its even quiet evident by looking at the graph as the ultimate tensile strength reached over 11KN whilst the others were far below this. However Sample A is much more ductile as the extension line on the graph proves.
- Metal samples U and Y
I noticed that the values of sample Y – pure aluminum on the graph were lower than those of our other metal materials, until it was alloyed, then its properties changed dramatically; it became stronger, and less ductile.
An alloy is a mixture of metals, which may have different and improved qualities from metal elements, which make it. Usually an alloy is made of one metal (the base metal – in this case aluminium) with small amounts of other metals added (which is copper). The other metals replace the position of the base metal in its structure. 8
Aluminium is a light weight metal that is known for its resistance to oxidation, strength, and it low cost. Several applications which this material is used for are cans, corvettes and spaceships, which proves how diverse this material can be. Aluminium alloys form vital components of aircraft and rockets as a result of their high strength to weight ratio. One disadvantage of using aluminium is that while it can support large loads like steel, it will flex a great amount. Although it will do this without breaking the amount of extra flex is great and this can be noticed on the results graph. The extension of sample Y reached over 10.5mm, it just stretches and stretches, and also it was the only sample that didn’t make a cracking sound when it did eventually reach its failing point. Thus, even though the strength of pure aluminium is not that great, it is very ductile. Being a ductile material is very important because when the stress is too high the component will deform before it breaks. 9
Aluminium’s strength is increased when certain impurities are added to form different alloys. Certain alloys like duralumin have high strength properties. Duralumin is an alloy of aluminium (94%), copper (4%) and magnesium (1%). There may also be small quantities of manganese and silicon in the alloy. Duralumin is a low density alloy that has a greater strength to weight ratio than aluminium. Duralmin`s properties mean that it is very suitable to be used for aeroplanes because of its high tensile strength and high breaking strength. And is likely to be of the same characteristics to that of our sample U. Sample U has 4% copper alloy, and because of this it has increased strength, however has lost some durability.
The result graph show that sample U is a very strong material that will not break easily which means it can withstand large forces, this due to copper added.
Aluminium-copper alloys containing 2 to 10% Cu, generally with other additions, form important families of alloys. Copper is the principal alloying element in this sample. These alloys normally require solution heat-treatment to obtain optimum properties. Also artificial aging can be used to further increase the mechanical properties. This treatment materially increases yield strength, with attendant loss in elongation. 10
Conclusion
In this experiment, we determined the mechanical characteristics of four unknown samples. Based on collected data we were able to describe such characteristics as relative hardness and stress-strain characteristics. Combining these mechanical properties with the theory of material science, we were able to explain some of the characteristics of our materials and assume their compositions.
In conclusion it was evident that the inclusion and alloying metals could alter how ductile they were and their strength. Samples Y and A were the most ductile materials and the Young modulus of Steel (sample F) revealed that it is the stiffest material. Sample F was found to be the strongest material because of its high tensile and breaking strength, however it wasn’t very malleable until carbon was added.
I feel that the accuracy of the results were satisfactory but they could have been improved by repeating the tensile test several times and taking an average.
Bibliography
- Advanced construction of building, Stephen Emmitt & Christopher Gorse