So when the windmill will spin it will
cut out light. However with preliminary
observations, I noticed that with gaps being
so larger the voltage reading was to varying
to decide on the correct value, so the size of
the gaps were reduced.
This was then decided as the final method to use to find measurements.
Apparatus:
-
Light dependant resistor – sensor to be used, influential in airflow monitor.
-
Circuit Board – where the circuit containing the potential divider circuit with the Light Dependant Resistor.
-
Torch – produces the artificial light, concentrated on the Light Dependant Resistor.
-
Connecting Wires – connect parts of the circuit.
-
Smarties tube – acts as a restriction of other types of lights (artificial and natural).
-
Fan – acts as the varying airflow.
-
Stand, boss, clamps – holds up the apparatus in elevated positions.
-
Resistor – acts to produce a potential divider circuit (ensures high voltage does not go thru the light dependant resistor)
-
Windmill structure – coincides with the fan to restrict amount of light.
-
Power pack - provides voltage/current.
-
Voltmeter (multimeter) – used to record measurements.
Method:
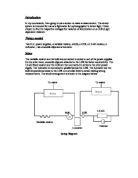
All the apparatus in the ‘apparatus list’ were gathered, and the equipment were set up like this:
The Light Dependant Resistor circuit is like this:
The whole circuit was turned on, and the total intensity on the torch was noted. Then a metre rule was placed down, right from the windmill structure. The fan was then placed 100 cm (1 metre) away from the windmill structure. It was turned on at speed 3 (of the fan) and after 5 seconds the voltage and current reading from the Light dependant Resistor was noted. This was done for distances, 100cm, 90cm, 80cm, 70cm, 60cm, 50cm, 40cm, 30cm, 20cm and 10cm. All the voltages and currents were noted.
I chose to do the measurements: 10cm, 20cm, 30cm, 40cm, 50cm, 60cm, 70cm, 80cm, 90cm, and 100cm. As anything larger then 100 cm would give little or no measurement, hence unnecessary. Also lower then 10 cm cannot be done, as it would be too close and the windmill won’t move due to collision with the windmill (0 cm). With the range I chose I can produce a large range on my graph to draw a good line of best fit.
Fair Testing:
Variable: Constant:
Distance of Fan Method of measuring p.d and current
Layout of apparatus
Light level from surrounding
Same Light dependant resistor.
Independent variable = voltage
If the constants were kept unvaried then this test would be under fair conditions. Only the distance of fan from the ‘windmill’ structure would be changed.
Prediction:
Its apparent from the calibration of Light Dependant Resistor that when the illumination increases on the sensor then the resistance will decrease. It’s also expected that a curved would also be produced, to coincide with this decrease of resistance. The graph expected is as follows:
The illumination is expected to increase when the distance of the fan from the windmill structure decreases. So of a graph of resistance against distance moved by fan, when the distance moved away increases the resistance decreases.
Safety Precautions:
Safety has to be analysed and assessed in this report to eliminate any risks that may occur. The main risks have been outlined and the safety precautions outlined:
-
Trailing wires due to a number of connections – ensure that the wires have been tucked away, and not in positions were people can trip leading to injury.
-
If the circuit containing the LDR is not connected in the correct way, then it may start ‘smoking’ leading to the circuit becoming dangerous – a circuit diagram would be drawn so the exact position of each component would be known to eliminate any mistakes.
-
The light source used could start to heat up if left unattended for a short spell of time – hence when the light source is not being used, then it should be turned off to ensure the heat around it does not reach to excessive levels.
Its apparent from the manufacturer’s production and my own deduction from past scientific knowledge that the results agree with the predictions made. Even though there are anomalies in the results a best fit curve can be drawn to outline the proportionality of resistance to illumination (distance of fan). The graph outlines what we predicted.
In the prediction I used past scientific knowledge to deduce a calibration curve of what will happen when the illumination increases (distance of fan from structure increases) compared to the resistance. Its apparent from the graph of the results gained that it agrees with the prediction made in the plan of the report. A clear curve has been produced, which shows that this experiment can aid in producing the characteristics of the sensor. The method of measuring the airflow produces a curve for which this sensor has been calibrated.
The graph can be viewed as reliable as it produces a best-fit curve, which is necessary to produce a reliable analysis. There is a good correlation of points to draw the curve. The reliability of the graph was dependant on the order of the points, for example:
However, its apparent from the graph that has been produced that there are points that do not fit the curve, and can be viewed as anomalies. It has already been discussed earlier in the report that if variables were the only part changed and constants strictly ensured to kept the same. This was done, but its apparent that something must have led to these anomalies, this is the errors in the investigation.
Errors played a big part in the production of anomalies and inaccuracies, either due to quantitative or qualitative. Within the experimental measurement we have made a judgement. For example, measuring the distance the fan is away from the windmill structure. We have to measure the length, were we sure that the measurement is accurate. Measuring the distance of the fan was performed like this, using a metre rule:
I have to judge the reading as 39 cm or 40 cm. If I decided as the reading of 40 cm being the closest to the mark on the rule. Since this is judged as to the nearest centimetre, we write:
Distance of Fan =
To reduce this error or uncertainty, you would need to use a different measuring device such as a traveling microscope.
In practice, virtually all experiments measurements have some degree of error associated with them. The error is shown by the number of significant figures quoted, and by the figures attached to the results. The term ‘error’ does not indicate that the experimenter has made a mistake; simply it indicates that the experimenter is aware that there is an uncertainty in the values presented which reflects the experimental method.
It is not just measurements of length which have an error associated with them. All measuring instruments introduce some degree of error. For example, analogue ammeters and voltmeters (in which a needle moves across a scale) – it is necessary to judge the position of the needle against the scale. The reading can be made to the nearest whole division on the scale, or the nearest half division.
Digital meters may seem more reliable, because they give an unambiguous reading – you just have to write it down. However, we usually assume that the meter is only accurate to 1 in the final digit of the display. So, if the reading is, say 2.25 V, we write this as:
Voltage =
This implies that the voltage lies somewhere between 2.24 V and 2.26 V. The sign indicates that we do not know whether the true value lies above or below the central value.
In order to get closer to a true result, we have to minimize the errors in an experiment. This can involve improving the equipment, or improving the technique that is being used. I have to critically view the techniques I have used, to view improvements to the experiment. The aim is to generate results that are reproducible; that is, you could repeat your experiment and obtain the same end result or close enough, within experimental error. Then you can be confident that you have done your best to achieve an answer close to the true result.
It helps to have an understanding of the different sorts of error, which may arise in experiments. There are two main types, random and systematic.
When I repeated the experiment, I did not achieve precisely the same results as the first time. The experimental conditions will vary slightly; one ammeter may be slightly different from another, or the method used is varied slightly. This means that a repeat result will be slightly higher or lower then a first result. (If I have estimated errors accurately, the repeat result should lie within the error of the original result). Variabilities of this sort introduce random error into the final result.
The errors associated with reading from scales on meters or rules are examples of random errors. Sometimes the actual length/distance will be above the nearest scale division, sometimes below it. This means that we would expect about half of measurements to be too high and half too low. Reducing random errors results in a more precise result.
The second type of error is the systematic error. An example is of a voltmeter, viewed at an inadequate angle and the eyes are not correctly aligned with the screen. The results would be recorded incorrectly. Viewing the screen directly at the right angle will eliminate this.
From this discussion, you can see that there is an important difference between random and systematic errors:
- Random errors can be reduced, by improving techniques, making multiple measurements or using instruments with a higher degree of precision, but they can never be eliminated completely. This increases the precision of the final result.
- Systematic errors can be reduced or totally eliminated by the use of better techniques and instruments. This increases the accuracy of the final result.
Errors within the experiment:
Maximum:
Minimum:
Maximum:
Minimum:
Maximum:
Minimum:
Several improvements could be made to this experiment to make it more efficient:
- The investigation should be performed in a room in total darkness, just allowing the light from the torch to provide the viewing light. This will eliminate all artificial lighting and natural lighting from the surroundings that would interfere with the results. We initially used a tunnel system to eliminate part of the light, but this is not totally sufficient. Hence, for the more accurate results and these anomalies to begin to be eliminated it would be useful to perform the test in a dark room.
- The structure of windmill model could be changed, because in its current state it catches the wind in one direction but when it spins the wind also interacts with the back of the cups slightly hence making it not function smoothly. The structure change should be like this:
In the new design the wind will always blow onto it and it will spin smoothly at a constant speed.
- Also the amount of wind change within the room, this could be due to open doors or movement within the room leading to slight changes and affecting the results. To eliminate this, the investigation could be done in an empty room, only one person to measure the results. Hence to eliminate any fluctuation in conditions.
Other methods could also be used to measure the airflow:
- Use a position sensor that would be positioned behind a pivoted card that would be affected by wind on it. Hence, when the wind blows on it, it would be pushed back on the sensor, hence a voltage value would be gained. The circuit would appear like this:
- The same method as I use in the report could be used but this time change the method of more accuracy. Use a motor connected to the piece of card, and the faster the motor moves, the faster the card moves (which has gaps to allow the light to come through), also a psion could also be used with a sensor such as a light gate to measure the speed of its movement at different levels.