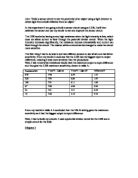
As shown in the table, I tested a 2.2kΩ resistor, and a 3.9kΩ resistor. I chose to use the 2.2kΩ resistor, as there is more differentiation between each value. The increasingly higher gradient on the graph is an indication of it’s superior sensitivity. I considered two decimal places to be a sufficient accuracy for this experiment as the trends are still very clear.
Figure 1.1
The dotted line around the beaker, bulb and LDR represents the paper shield that would be place on either side of the equipment.
Applying this Sensor in the Real World
In order to convert the sensor I have designed, into a device fit to operate as a switch for apparatus such as a street-light, many modifications would be required. It is paramount that the sensor operates only when needed, so it must be calibrated to engage at the correct resistance (potential difference reading). In order to determine the correct levels for this function, preliminary experiments will need to be carried out. For example, taking voltage readings at the intensity of light that the device will be required to illuminate at. The sensor would require a computer that uses a look-up table in order to use this data. I would suggest that the device is situated in a place that will not be influenced by the street lamp itself. The ideal place for this would be on the top, however other precautions will need to be taken to ensure its success. These would include carefully situating the lamp, to prevent the light being obstructed from the sensor by trees etc.
Experiment Design
I designed my experiment considering the influence of both internal and external factors. Firstly, I minimized the intensity of surrounding light by conducting the experiment in a dark room. I further prevented the penetration of any surrounding light energy by placing a shield of paper on each side of the equipment as shown in the experiment diagram.
The influence of heat on the experiment causes an inherent systematic error. As the temperature of the LDR increases, the resistance decreases. This is due to a positive temperature co-efficient. As the metal warms, the molecules posses more kinetic energy, so move more freely. This allows the electrons to flow more easily through the conductor. However, this can work in reverse if the molecules possess so much kinetic energy that they collide with the electrons too often and inhibit their passage. I had considered this factor during planning, however sufficient equipment to rectify the problem was not available. If possible, I would have used a cooling device, operated by a thermostat to maintain a constant temperature and further increase the integrity of my results. However, this device would need to be very sensitive and quick to respond, as the differentiations in temperature would be very small.
To prevent the resistance of the potential divider circuit influencing the illumination of the lamp, I have used two separate power sources.
The Experiment & Equipment
I carefully selected the apparatus used in this experiment to maximize the accuracy and integrity of the results.
-
Power Pack x 2 - In this experiment I used a separate power supply for the potential
divider circuit and the light source. My reason for implementing this is
that the resistance of the potential divider circuit could affect the
intensity of light emitted by the bulb, thus producing unreliable results.
-
Glass Beaker - I decided to use a glass beaker as it is transparent. The beaker I will use
had a capacity of 1litre. As I am using water in conjunction with
electricity, I will only fill the beaker with 750ml to reduce the risk of any
spills.
-
LDR & Resistor - I have used the LDR to detect the levels of illumination in the
experiment. I decided on this resistance of LDR and Resistor as they
are of very close values and produce a potential divider circuit of
appropriately high sensitivity.
-
Wires - Used to connect circuit components
-
Voltmeter - I used a digital voltmeter for increased accuracy. Using this I measured the
potential difference across the normal resistor, which will vary as the LDR is
exposed to different intensities of light.
-
Lamp - I used this as the means for illumination (in circuit below).
The first stage of the experiment is to fill the beaker with 750ml of water. The light bulb and LDR are placed so that they are touching the beaker on opposite sides. I will ensure that this is the same throughout the series of readings. Paper is put on either side of this apparatus to ensure that minimal surrounding light penetrates, and minimal light from the bulb escapes. The sensor is connected to one power pack set to 5V, and the light source is connected to another set to 12V. The LDR and resistor must be connected in series, and a digital voltmeter needs to be in parallel with the resistor. The first reading will be taken before any milk powder is added. There after the milk powder will be added in five increments of 2g. The milk powder is used as a means of reducing the intensity of light that reaches the LDR and will be stirred when added. The calibration curve in the results will enable you to find the potential difference when you know the mass of milk powder, and visa versa. I have recorded my results in the form of a table. The graph utilises the Average (mean) potential difference and the mass of milk powder.
Results
The table below is the record of results from the main experiment. I have included the mode and median averages, which show the same pattern of positive correlation.
The four highlighted voltage readings are slightly higher than the others in their rows. I think that the reason for this is that the solution was still moving after stirring. This would cause large particles of milk powder to float around and inhibit the passage of light. The most effective way of rectifying this problem in future experiments, will be to let each sample settle for the same amount of time before taking a reading.
There is a more accurate, hand drawn copy of this graph on the next page. The line of best fit illustrates the occurring pattern more successfully.
My findings support the theory that the potential difference across the resistor will increase as the inhibition of light penetration increases. The LDR consists of a piece of semi-conducting material. Decreasing the intensity of the incident light results in the creation of less conduction electrons in the semiconductor, so resistance increases.
Fair & Safe Test
Fair
In order to maintain a fair test, I ensured that I kept all variables the same for each trial. Firstly, the increment of milk powder changed the intensity of light reaching the LDR. I was careful when measuring the mass on the electronic scales, accurate to 0.01g. I measured the volume of water using a 1litre cylinder. I then transferred it to the beaker, making sure that I maximized the amount that I successfully poured, leaving no drips left in bottom. Another important factor is the water temperature. I replaced the water after every attempt to ensure that the heat of the light bulb had no effect on the milk powder solution. After every refill I was very careful to replace the light bulb and LDR to the same position after refilling the water. Not only the distance, but also the angle of each of these components could have a significant effect on measurements, as I discovered in another preliminary experiment. The direct passage of light is very important, so I used one sheet of paper on each side of these instruments to channel all light in the right direction. Finally, I kept all power supplies and meters on the same settings for each reading.
Safe
The main safety aspect while conducting this experiment was the usage of electricity in conjunction with water. To reduce the likelihood of spillages, I only filled the 1litre beaker to 750ml. This was done for each trial. I used long leads to enable me to distance the power source from the water.
Analysis & Evaluation
Resolution
Due to the nature of the equipment that I have used in this investigation, the resolution of my sensor is 0.01 Volts. This is the smallest measurement that the voltmeter used would facilitate. The graph indicates that this resolution is not sufficient. The line of best fit for the potential difference across the LDR should look like Graph 1. This would mean that the line of best fit for the fixed resistor should resemble Graph 2.
It is clear that there is familiarity between Graph 2 and the graph in my results. However, from 0 – 2g of milk powder there is a very shallow curve, creating an “S” shaped graph. This implies that these measurements have been taken on too high a scale. Due to this I consider any readings up to 2g of milk powder unreliable. This resolution limit could be improved by taking measurements to a higher number of decimal places, which would require more advanced equipment.
Range
My average result values range from 0.32v to 1.28v. This is the largest possible range with the available equipment as shown in the preliminary experiment. If possible, I would have used a fixed resistor of a slightly closer value to the LDR. This would have produced a higher sensitivity and a wider range. However, this range provides a suitable set of results to reinforce the theory of this sensor.
Sensitivity
The graph illustrates that the sensitivity of the sensor decreases as the intensity of incident light decreases (as more milk powder is added). This is shown by the levelling off curve. As the resistance of the semiconductor decreases, there are increasingly more conduction electrons within it. There is a limit to the capacity that it can hold, so it will be able to hold less and less until in can’t hold any more. This will be the point at which the line completely levels off.
Response Time
The response time of my sensor is very quick. However, the procedure that I carried out required me to wait for the water to settle. This may not be the case if it were used in real life.
Conclusion
In this investigation I have successfully designed, built and tested a sensor which produces results with a.