- The Work Sheets, Formulas and Functions I plan to
Use
- The Worksheets I Will Create
I will create several worksheets these include ticket sales, graph data, year 7 8 and 9 graphs, a pie chart and a head teachers summary.
- The Functions That I Will Use
I will use two functions on my ticket sales sheet and graph data sheet, these are ‘if’ and ‘sum’ functions. I will only use the ‘if’ function once this is when I am trying to find out how many tickets I have left.
- The formulas I will use
I will use formulas to help me calculate my total cost, total number of tickets sold, are tickets still available and total income from ticket sales.
- How I created the worksheets
- The Ticket Sales Worksheet
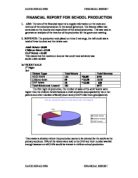
The ticket sales work sheet was the first sheet I created it tells you the cost of the tickets, pupils that have bought them, their form, quantity, whether they have paid, how many tickets sold altogether, the total income from the tickets and if there are still tickets available.
After inputting all of my data I formatted my ticketsales sheet.
I added colour to my sheet by clicking these buttons.
Although on this particular sheet I only used this button
This is because I didn’t wont to colour my text in.
I also used formatting to determin wheather the pupils have paid or not. I also put all of forms in order numericly by year group then alphabetically by form.
- The Graph Data Worksheet
To create the graph data table I used the pupils’ forms from the my ticket sales sheet to help my calculate how many tickets were bought in total for each form.
I repeated this process for all 9 forms using a formula. The formula is slightly adapted for each form. This is the formula I used for 7AH: =SUM('ticket sales'!E8:G13) .
After completing this process with all the forms in year 7 I then used a formula to total the amount of tickets sold in all the forms.The formula I used is: =SUM(A3:C3). This automatically adds up the total tickets sold for all year 7 forms, this would be slightly adapted to calculate all year 8 and 9 forms.
- The Graphs I Created
To create this graph
I first selected this information.
Then selected this button.
This screen come up all you have to do is choose the type of graph you want and then follow the instructions.
Until u reach the end and have a graph like this
- How I created my Summary Data sheet
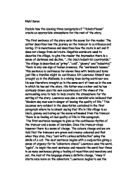
I created a summary data sheet and named it ‘ Head Teachers Summary’
- The Formulas and Functions I Used
The formulas I used are detailed above in the following points 3.2 and 3.3.
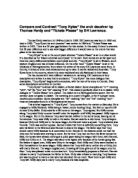
6.0 The Graphs I created and Why I Created them
I created the graphs to show my findings and make a comparison to the amount of tickets sold in each form and each year.
I used bar chart graphs to compare the tickets sold in each year. But for the comparison of all the tickets sold together.
- Explanation of How My Spreadsheet Answers ‘IF’ Queries
I have used the ‘IF’ function to tell me if there are any seats available. To do this I entered the following formula: =IF(H2<300,"yes","no").
- How I used the SORT Function
- How I Ensured My Work Was Accurate And Safe