Pedestrian flows were conducted in a linear pattern all over Winchester. The reason this was collected is that it provides a good measure of accessibility for each shop around the city. Obviously the more people that pass a point the more accessible it is. It was a systematic sample as we collected counts all over the city along the high streets and through the side alleys as well. As there were so many points (over 25) then each group was allocated a certain amount of counts to be done. It was done by simply counting the number of people passing a point in both directions over a time period of one minute, which was then repeated. This was further repeated at both 10:30 and 11:30, as different amounts of people may choose to shop at different times, and these times adequately covered the data we needed in the time we had available.
Ideally we would like to find out the price of each shop in Winchester. However we can’t get hold of accurate values as many premises have not been on the market for long periods and also the prices paid for them may be disclosed by the company that purchased the premises. For this reason secondary data was collected in the form of taxable values for each shop obtained from the internet at . The rateable value is set out in law. It is the yearly rent at which a property might reasonably have been expected to be had it been put on the market. This data is then collected and condensed and put on the internet where it was obtained by us and analysed.
DATA PRESENTATION
The reason I drew a chloropeth map was that it is simple to draw and it also is very easy to represent data in an accurate way. This also meant that it was very useful in proving or disproving some of the hypotheses I made. By colour coding it I can easily pick out the most expensive properties to own and rent and compare them to any of the other maps that I have drawn. The main disadvantage of this is that it uses quite a broad scale so many values that are statistically different are all included in the same group. However this is limited as the human eye is only trained to see a maximum of 6 or 7 colours, so we could t accurately use more otherwise e would not be able to pick up difference easily.
The isoline map I drew was very useful as it gives a very clear representation of the general area surrounding certain points where pedestrian data was collected. It also gives this in relation to the other points and it can easily show the most accessible areas. The main disadvantage with this way is that is can also exclude differences in data that is at both ends of a group, but are still in the same group, and therefore some area’s may not have the correct isoline’s in them, and therefore the data can be easily distorted.
The flow chart gives us a clear view of just how many people pass an area in one minute. It is good as it shows where people who have been walking down one street do when the reach a junction, and it also shows us if any side alleys can attract a lot of people due to large difference in similar and nearby streets. This only shows people flow of over 20 people as under this, lines would be inaccurate.
Nearest neighbour analysis was used as it provides a greatly significant set of value to indicate the clustering of certain lane uses. It was done by plotting points on every shop type of similar function. This was then put into the nearest neighbour equation, and a set of values obtained for every different function.
The Spearman’s rank graph was used to show pedestrian flow around a point and the distance of that point form the PLVI.
ANALYSIS AND INTERPRETATION
My original hypotheses were
- Similar land uses cluster together
- Land use is related to Land values
- Land values are related to accessibility
Using the colour chloropleth map we can easily identify some key features. We can see that most of the comparison or Chain shops occupy the main high street. They are quite clustered together and occupy around the PLVI and mainly to the left of it. There also seems to be a pattern of Food service shops along Jewry Street. These occupy most of the available floor space. However retail services tend to be very spread out throughout the city but they only occupy areas away from the high street, and mainly down side alleys. By comparing this to the land values map it is clear to me that Land use is related to land value. As in my introduction I said that Comparison shops would tend to occupy the most expensive shop types. The most expensive shop types are directly on the high street and very near to the PLVI. I can also see that the cheapest shop types are generally overrun by financial services. This is quite apparent in the northern area of the Land use map. By using nearest neighbour analysis, I can find out rateable values for each shop type. They are as follows:
Comparison goods: 0.44- clustered distribution
Convenience goods: 0.86- quite evenly spaced
Financial services: 0.27- very clustered
Retail services: 0.79- relatively evenly spaced
Food services: 0.10-very clustered distribution
Specialist shops: 0.74- relatively evenly spaced
This means that the independent variable (Number of pedestrians) increases as the dependant variable decreases. (Distance from the PLVI.)
Nearest neighbour, suggest that only some shop patterns will cluster together.
I am quite happy with all the data I obtained from the nearest neighbour data. It is all quite similar to what I would have thought, and it helps to support the predictions I made in the introductions and aims.
The link between land use and accessibility is shown on the computer drawn graph. This shows that we don’t have perfect results as many of our points lie quite far from the line of best fit. However we can get some information from our graph:
Using the spearman’s rank programme on the computer I drew up a graph of number of pedestrians passing a point against the distance of that point from the PLVI.
I found out that the Gradient of the line was -5.625 and the Y-intercept was 450, from the line of best fit. By putting this information into the equation Y=mx+c we get a relationship, which is number of pedestrians passing a point multiplied by -5.625 plus 450, gives you an estimate of how far that point is from the PLVI.
No of People * -5.625 + 450 = distance from PLVI
However this is only an estimate and is not a direct rule. It could be wrong for all we know, but it still can give us an equation to make very rough estimates of data.
The spearman’s rank coefficient I obtained was -0.518. This enables me to say that I am over 95% confident that my results are accurate. As it is smaller than 5% error but is larger than 1%. Therefore my results are quite statistically significant. However they will not provide a perfect rule and any values obtained will be distorted from what they actually would have been
CONCLUSIONS AND EVALUTATION
The aim of this section is to summarise and draw threads together to make logical conclusions. To also return to the aims of the enquiry and to evaluate and state specific findings, and to recognise limitations of the evidence and the conclusions drawn.
In Winchester and the area of study, there are many different shop types. These are all there for many different reasons. Different shop types occupy different areas of the CBD, due to supply and demand and the bid rent theory outlined in the aims section. The most clustered shop types are financial services, comparison good shops and most of all food shops. The reason for ties distribution of food shops I think is that food shops tend to group together as they want to create a certain atmosphere and also if they are near their competitors they are competing with every restaurant customer. The land where they are clustered is cheap, so this enables many firms to easily start up. This has lead to more shops starting up in the same areas. Financial services tend to cluster together as the land where they cluster is cheap and as they generally don’t need to have prime locations on the CBD, because people tend to go out of their way for any type of financial service.
Retail services are quite price competitive so they need to be evenly spaced in order to try and create as large a customer base as possible. They also have low customer usage rates as customers tend to only use them on rare occasions. They therefore only make sales irregularly so will tend to be small in number and also not be located on the high street as they will not be able to compete on a price basis. Convenience goods shops also tend to be quite evenly distributed as they are generally shops that are needed on an almost daily basis and therefore they can move their shop anywhere, preferably the cheapest area possible, and they will still get the customer bases they need to operate and still make a profit.
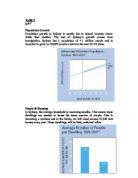
Land Values are related to accessibility directly. If an area has lots of people (i.e. high numbers of pedestrian flow) over a constant period of time, then the prices in that area will be shot up. It is simple supply and demand as indicated in the introduction. This is further supported by the bid rent theory (see diagram and introduction) Places such as Marks and Spencer’s will have more capital to buy an expensive property than I first time shop manager will. Therefore they will get the prime locations, and smaller shops will be located further out of the city.
Land use is also directly linked to land values, as shown on the map, and nearest neighbour analysis shows this information. Different types of shop need different locations to sell their goods. Shop’s that are comparisons shops have huge sales daily and have hundreds of customers passing through their doors each day. They therefore make a lot of money and larger profits than the rest. They also have larger customer bases and their reputations are very good indeed. They can therefore get the most expensive land values and easily be able to pay high tax levels. It is these shops that have the largest threshold populations, so position is the main aspect regardless of the land value
Looking back it seems to me that all my readings and Hypotheses tended to be relatively accurate, and mostly correct.
The main limitations of the data I collected were as follows.
The data we collected was on a Wednesday. This is in the middle of the working week. The time we collected the data was also in the middle of the day before lunch hour and after all the workers has gone to work in the city. This can easily distort the data. The population flows on every day are completely different to each other. The population counts on a Saturday would yield much higher results, and this would also be the case if the results were done on a Sunday. Also if the results were carried out at different times, such as lunch hour then the results would be completely different. The flow of people will change dramatically throughout the day, and as we only had time to do a brief period then we were unable to do it at regular intervals throughout a whole day.
The weather outside and the season also influences the amount of people shopping in a n area. If we were to take the readings on a sunny day we would hope to find more people outside enjoying the sun. The results we collected were done on a cold morning so there may have been many people who did not want to come out of their house’s to go shopping. Also, if we collected results at Christmas and time’s surrounding this we would indefinitely get more people.
Some shops were also quite hard to classify into certain groups, as some may have fallen into two different shop types, such as marks and Spencer’s food hall and clothes department and kitchenware. This meant we had to draw the most obvious parallel from the shop and record it on our goad maps. Also some shops were quite hard to see what they were and they had no outside marking to identify their features. To go into some shops would have been improper as it would have taken out too much of our precious time.
Further investigation could include us carrying out the following:
If we had more time then we could have done our data collection over a longer period of time, and over many weeks, and therefore we could have a lot of raw data which we could have easily summarised and averaged out to get much better and fairer readings. We could have also done pedestrian counts throughout the day at regular intervals. This would have given us a wider base to draw our conclusions from.
We could have also done population counts around side alleys, and at closer intervals, and also have increased the area we covered. This means that we would have more information about the flow of pedestrians around the city, and where the most accessible areas are, and it would give us that information much clearer and precise than we did.
By doing counts outside restaurants as well we could have got indications of the flow of people who passed outside restaurants and those who went in, and would also show us how many people from the high street made their way up Jewry Street to go and eat.
We could have also found out the threshold populations for each shop type in the area of study, as I think that location of shops is directly linked to the shops threshold population. A shop with a large threshold population will need a prime location in order to justify it setting up in that area in the first place. It will probably also make more money as it will have a better reputation and bigger sales.
We could have also carried out land use and land values on shops that are above ground level. This may be of use as some shop types may prefer to be on the second level, and we did no take this into account. This could have made some shop types nearest neighbour analysis completely wrong. We could have also done a questionnaire and found out the sphere of influence of each shop. This would show us how each of the pedestrians we counted got to Winchester. This would in turn show us the accessibility of Winchester to the rest of the south and maybe beyond. Finally we could work out if people travelled by car where they parked as this may have a direct influence on the location of some shops, as they would get quite a lot of pedestrians passing them. This is also apparent outside the bus stops and train station.
By doing this we would be able to draw better conclusions from better graphs and data we collected, and would broaden our knowledge of the area of Winchester CBD.