Over the last fifty years China has changed a lot as in 1949 it was considered as one of the world’s poorest countries and in 1978, China ranked only 27th in the world with its external trade amounting to $20.64 billion, of which exports accounted for $9.75 billion and imports $10.89 billion. Yet in 2005 imports accounted for $762 billion and exports $660 billion, and so now it is an NIC.
In fact it would and will be an MEDC however it missed the Industrial revolution of the 19th Century and for decades war and civil conflict damaged the infrastructure and the proper expenditure from the government. However now, its economy had the fastest growth since 1995 in 2006 when it expanded by 10.7%.
The death of the President Mao and the leadership of Deng Xiaoping in 1978 resulted in a fundamental change to China’s economy. He wanted to open the country to more foreign trade and investment and the agricultural production shot up. China became more industrialized and with an increase in money new and efficient factories were built in the cities. Foreign investment poured into China as it became one of the world’s largest exporters and the agricultural populations migrated and are still migrating to the bigger cities where there is still a growth of factories so there are many job oppurtunities. Foreign investment remains a strong element in China's remarkable expansion in world trade and has been an important factor in the growth of urban jobs.
China opened its service sector and the telecommuncations services and fininancle services has been seen as a great potential for investment by other developed countries. Also, it has been able to go into further investment with its wealthy neighbours – South Korea, Japan etc who are now MEDC’s with high technology industries.
The job sector changed from in 1952 agriculture being the main economy and within 25 years Industry became the main economy. The graph below shows that in 1997 Industry was at 48% of the country’s economy, agriculture had decreased and services was also up.
Through the process of opening up its economy and trade and exporting labour-intensive products and importing technology intensive products it has been able to develop rapidly.
There are still problems of inequality of wealth as many people are living in poverty.. The number of rural poor is 13.5% of the population and these rural areas are being left behind just like Uganda as the eocnomic development has mainly been concentrated on the coastal provinces.
China had not yet been released from the powers of censorship and has not experienced social freedom as many abuses of civil rights hinder their economic growth.
The Natural resources of China are: Coal, iron ore, petroleum, natural gas, mercury, tin, tungsten, antimony, manganese, molybdenum, vanadium, magnetite, aluminum, lead, zinc, uranium, and the world’s largest hydropower potential.
China sells cheaper goods and is involved in many industries especially the textiles and clothing, toys and consumer electronics. It is also beginning to increasingly get involved with high technology products and is closgin the gap between many MEDC’s as it may be now the fourth biggest economy in the world – overtaking Italy and could soon overtake UK and France.
Below are some graphs describing how the country is changing and developing. All these graphs are updated to 2007 and are from
Birth Rate
13.45 births/1000 population
Because China is still an NIC we cannot easily see the indications that it is no longer an LEDC and this is why although the birth rate has gone up which usually indicates a higher need for children in the family to look after people, in this case I do not think that is true.
Infant Mortality
Infant mortality rate: 22.12 deaths/1,000 live births
This is a promising sign that China is an NIC because it shows an improve in health care so the babies when born can stay alive through better technology.
Literacy
The education standards must have got better over the whole country as the literacy rate has increased.
Life Expectancy
Life expectancy at birth: 72.88 years
This graph shows the increase in Health care and general well being of the population.
GDP/Capita (U$ Dollars)
GDP - per capita (PPP): $7,700 (2006 est.)
This graph shows that the amount of money that people have has slowly been increasing and through 4 years from 2003 and 2007 it has almost doubled.
Unemployment Rate
Exports: $974 billion f.o.b. (2006 est.)
Definition: This entry provides the total US dollar amount of exports on an f.o.b. (free on board) basis.
Imports: $777.9 billion f.o.b. (2006 est.)
Country B – My LEDC
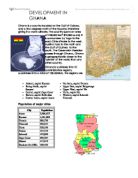
Uganda is an LEDC - a Less Economically Developed Country which is either very slowly expanding in terms of economic strength, or not expanding at all.
It is a thickly populated country in east central Africa, west of Kenya and south of Sudan.
Over the past fifty years the development of Uganda has not been as rapid as the NIC. There has been no real industrial revolution as much of the population are still in the primary agriculture job sector. Therefore most people live in rural areas and do not come to the urban cities as there are little prospects of getting a job.
The graphs below show how Uganda is developing according to the indicators in my introduction.
Birth rate: 48.12 births/1,000 population (2007 est.) Although it has increased only slightly the Birth rate shows that the people in Uganda need more children in order to look after themselves and the family if the parents die or just for extra money needed to provide for the family.
However the death rate has decreased substantially since 2003 which shows signs in improvement for perhaps health care or less civil war.
The infant mortality rate has also dropped which could again show an increase in health care. Infant mortality rate: total: 67.22 deaths/1,000 live births
The Life expectancy has increased because of this reason as well. It shows that the overall quality of life has improved and shows that there may have been an investment in human capital.
Life expectancy at birth: total population: 51.75 years
Literacy: definition: age 15 and over can read and write
total population: 66.8%
The education must have got better over the whole country as the literacy rate has increased.
The amount of money the people have has also increased.
Exports: $961.7 million f.o.b. (2006 est.)
Exports are important and are a reason for the increase in GDP and therefore people have more money to spend on health care and education. Uganda has been trying to get involved with more foreign trade.
Imports: $1.945 billion f.o.b. (2006 est.)
There is more money for the country overall to buy in more goods from other countries.
However, although these graphs make the country seem promising in terms of development, it is still an LEDC.
This is because political problems in the past caused an economic collapse and it became difficult to trade with the outside world, the currency was almost worthless during this time and so Uganda has not had a head start in the industrialization process which is why it is not an NIC now.
The government under a new leader have tried to recover the economy and the graphs showed improvements in the nation’s commercial, economic, and social infrastructures.
But the development of Uganda and its economy is slow because of poverty and infectious diseases, lack of infrastructure, and low capacity for business development.
Also, civil wars in northern and western Uganda have resulted in massive expenditure on the military personnel and equipment which could otherwise be used to develop the economy.
According to international standards, Uganda still ranks amongst the twenty poorest countries in the world in terms of gross national product (GNP) per capita, with over 50% of the population living below the official poverty line.
The HIV/AIDS epidemic has also had a huge effect because the most productive people ages of 30 and 40 are the ones dying.
There has been a growth in the inequality of wealth because some privileged groups and in some regions they people benefit from the economic growth while others are left behind. These people are usually from rural areas where most people do low productivity subsistence farming.
8/10 people live in rural areas and yet though the economy is improving they have had little access to financial services, have poor infrastructure and communication and they are not able to access the large markets.
The chief food crops made by Ugandans are bananas, beans, cassava, corn, millet and sweet potatoes however only coffee, cotton, sugar cane and tea are raised the most in order to export to other countries. The country itself has rich deposits of many minerals but does not put it to good use and only copper is mined on a large scale.