- Wave strength
- Rock resistance
Wave strength can cause different sizes of caves because different place have different wave strength. If the wave strength is greater then the cliff will erode faster.
Rock resistance also controls wave erosion of the cliffs. Rocks vary in hardness. Softer rock will erode faster and harder rock will erode slower. Rocks are of different hardness because rocks are of different types. They can be sedimentary, igneous or metamorphic. It also cause by the density and the age of rocks.
Thanet is in the south east corner of the UK (as shown in Fig.1), Pegwell Bay is on the south coast of Thanet (as shown in Fig.2),
Pegwell Bay is between Ramsgate and Sandwich ( as shown in Fig.3)
Fig.1 Map of south east England
Fig.2 Map of East Kent
Fig.3 Map of Pegwell Bay
Waves approach Pegwell Bay from the east, and get weaker westwards as shown in the diagram below:
Aim
My general aim is to investigate wave erosion along the chalk cliffs of Pegwell Bay. I intend to measure cave sizes, as these are forming readily here. I will investigate two hypothesis (1) Cave size increases from the west to east, and (2) Caves have increased in size over the period 1993 to 2005. I will try to prove or disprove these hypotheses by comparing the 2 sets of data.
Methods
When I collected the primary data I had to go to Pegwell bay. We had to check the tide time first because of risk assessment. The high tide times were 5:18 a.m. and 5:28 p.m. We shouldn’t go there then because caves are mostly covered at high tide and it is very dangerous.
I went to Pegwell bay, Cliffsend, Isle of Thanet, Monday, July 3rd 2006; around 12 p.m. when it was low tide (Low tide at that day was 11:42 a.m.)
I started looking at cave size and shape at about 1 p.m. We measure the caves with a measuring tape and a ranging pole. Some caves were very big, so we only measured 4 of them.
I had a biased result. Biased result is to find out which set of data is mostly appear in the table as the biggest number. For example, if all the caves are very deep than caves are biased to the depth. I did a biased test with the data I collected from the caves, it came out with we biased on the depth.
Results
Here is the primary data:
Primary data is the data we measured ourselves.
Measurement of caves in Pegwell Bay (July 2006)
Here is the graph to show the caves size from west to east:
Here is the secondary data for 1993:
Secondary data is the data that I get it from the internet.
Here is the graph to show the cave sizes from west to east in 1993:
Here is the secondary data for 2005:
Here is the graph to show the cave sizes from west to east in 2005:
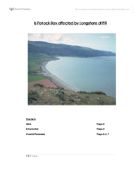
A cave in Pegwell Bay.
Analysis
The results show that in June 1993 the sizes of the cave from east to west are increasing except few outliners. The volume of cave 1 in 1993 is 14.88m3 and cave 20 is 91.8m3. This shows that a cave in the west is bigger than a cave in east. There are some outliners like cave 11 and 18. Their volumes are 178.56m3 and 268.75m3. I think this is because different rock has the different hardness. This is call differential resistance. The cliff in Pegwell bay has many faultlines and the cave can be eroded by the waves very easily. Caves are expanded faultlines. This is why the caves that measured in 2005 is much bigger than 1993. The winds approach from the east is very strong. The winds from the east are dominant winds. Dominant winds mean winds that blow with the greatest strength. The caves in the east are eroded by the stronger waves because the winds are coming from the east and as the winds approach to the west, they become weaker. This is why the caves in the east are bigger than in the west. The sizes of the cave from 1993 to 2005 had been increased. In 1993 the average volume is 71.91m3 (only the first 13 caves). In 2005 the average volume is 163.54 m3. Which means the cave sizes had increase from 1993 to 2005 but it is not very accurate because in 2005 there are only 13 caves measured.
Caves are formed in evolutionary stages as the diagram shown below:
Conclusion
I investigated two hypotheses (1) Cave size increases from the west to east, and (2) Caves have increased in size over the period 1993 to 2005. I will accept the first hypothesis because the sizes of cave increase from the west to the east. The result shows that as the caves go from the west to the east, the sizes increase but some caves are out of the ordinary. Unfortunately, I will reject the second hypothesis. Although the data shows that the caves in 2005 are generally bigger than 1993, it is not that accurate because in 2005 the data only show 13 caves while in 1993 there are 20. I didn’t record the data so I don’t which cave is which. For example the volume of the 1st cave in 1993 is 14.88m3 and in 2005 the volume is 8.568m3. Will the caves get smaller? I know the fact that the sizes of the cave will increase due to the time but it is not proven in this result. If I were to re-do this project, I will make sure that the data is fairy accurate and I will measure more caves in my primary data.