Less than 100k , 100k -199.99k, 200k-299.99k, 300k and over
I will have a colour for each street on a table with all the categories.
Housing Quality:
I will collect this data by (again) stopping every 100m and at the house next to me, I will work on a point system and give a house 60 points. I will then take off 1 point for every flaw I can see e.g. cracks, woodworm on doors etc.
I will this time show my data using a scatter graph, as I believe it will be easiest to show my results in this form. This will (hopefully) prove my prediction.
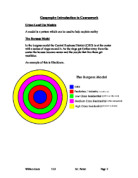
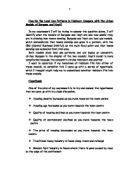
Here is a map of the streets I will be doing: Example of a Data collection form
Results
Litter Count:
House Pricing:
N.B. N/A = No Houses in Area k = thousand e.g. 130k = £130000
All Prices are in Pounds (£)
Housing Quality:
Graphs
Data Analysis
Looking at my graphs, I have come to conclude that my prediction was correct. There is a general trend that points to the fact that Stourbridge follows the Burgess model. My results show that Birmingham Street and Stourbridge Road are the worst streets in account with litter and Hagley Road had the most change with 52 pieces of litter in the CBD and 12 pieces of litter on the 4th stop. This is a 43.3% drop in litter as we get further away. I have also worked out that in housing qualities aspects that the south of the CBD e.g. Norton Road and Hagley Road as these had high values with the lowest being 43 points. Compared to all the others there is a significant percentage drop when compared to the highest. With the lowest score being 18 and the highest score being 57 there is a 31.6% difference. This also has an anomaly in it. The score 57 is nearest the CBD. This is not what I expected which was to have the lowest scores nearest the CBD and the highest scores outside of the CBD. There is a general trend of my theory.
Here is my table again except with anomalies in red
There are a few possible explanations for this; one explanation could be that a few vandals terrorize that part of town and graffiti the houses there. I could have been in a different mood and that could have affected my decision.
With the litter count there are, again, a few anomalies.
These don’t match with the Burgess model or the Hoyt model although the others, again, do follow the Burgess. One of the explanations of this is that on the day when recording the Audnam High Street, a fierce gale picked up blowing rubbish everywhere. Other possible explanations could be that a bin was knocked over or I miscounted the data.
Evaluation
I think this project has concluded that the Burgess model does exist inside Stourbridge. Although the information I have collected will not be exactly correct as I have anomalies and no doubt have miscounted a few things. To make sure that I had 100% correctness I would have to stop at every piece of litter and every house, I would also have to go on the estate agents website and find the price of every single house. This would be impractical as it would take too long and I don’t have that time. The litter count could not have been correct completely as many things affect it e.g. a litter picker could have cleaned the streets. To make sure of my results I would have to do the recording about 3 times each. Also to improve on my data I could take readings on branches out of the main roads and follow the rings around the model to see how circular the model is in Stourbridge. To make my investigation better I could put my results in different types of graphs e.g. line graph or pie chart. I could also put all my data into one graph for easier comparing. Data could be put on a map so its easier to see what goes where.
Overall, I am pleased with my investigation but if there were one thing I’d change, it would be to make my investigation more precise by taking the results from the branches from the main road and take the results 3 times on different days.