Effects of Tourism
Effects on the dunes ecosystem by walkers and trampling
Oxwich Bay has a diversity of vegetation and flora such as marram grass, bracken, birch trees, sea spurge etc. The area is very popular with ramblers/walkers and there is a walk that cuts through Oxwich Bay via reserve.
Human beings are a problem because they trample on the vegetation, which then dies allowing the sand to blow away, causing a blow- out. These effects can be managed by keeping the tourists off the dunes. Fences can be used to isolate areas or footpaths used to keep people in specific areas. Re-planting with marram grass in the fixed dunes allows repairs and prevention of further damage.
Trampling is a major problem because it can affect stability of the whole dune ecosystem. Trampling has the effect of decreasing vegetation cover, increasing sand density and thereby reducing infiltration of moisture. Soil thickness and nutrient content decrease. This in turn will affect the amount of producers in the food chain; can mean fewer habitats for species such as small mammals, resulting in less primary consumers. With this combined effect the whole food chain of the dunes could break down which would lead to less biodiversity (fewer different types of species). Consequently Oxwich Bay would become less of an important ecosystem and this ecosystem may change its entire nature.
To combat the problem of walkers, the NCC have laid footpaths and signed these so that walkers will stick to these defined routes and not roam all over the dunes. However the main problem appears to arise from casual walkers entering the dunes from the beach or people sheltering from the wind or seeking privacy. This is evident from the large number of footpaths close to the beach. Our studies also show that footpaths closest to the beach are also widest and also, to some extent from the Spearman’s rank test, that the wider the footpath the greater the area trampled.
The effect of litter in the dunes
There was some evidence of litter along the various paths, but not a lot of it. The litter that was found was generally plastic bags and bottles, together with paper.
Whilst the litter found was not too destructive, animals can be harmed by litter e.g. sharp cans etc. Litter can also affect vegetation for example paper obscuring the light, not letting the plants photosynthesise.
There were some bins, the largest sighted at the car park, there were none within the main reserve. In general, reliance is placed on the tourists to take litter away with them from the beach and the dunes. At the time of our study, outside the peak season for tourists, there was very little litter. During peak season these observations may change. There was no definite relationship with distance shown by our litter survey to support the expectation of increased litter close to the beach.
Traffic congestion and pollution effects on area
There were only two coaches and five cars in Oxwich Bay at the time of our study. There was little traffic on the roads at the time of our visit to the Bay. However the roads at Oxwich Bay were seen to be narrow, twisty, had walls alongside them, had overgrown trees making them narrow to large vehicles and they were hilly in places. If coaches and cars are going in opposite directions they will have to stop in passing places and start off uphill, which is when they are at their most inefficient.
With the volume of people who visit the bay there is undoubtedly congestion on the narrow roads into the area, around the village and the Reserve. Oxwich Bay receives around 250,000 visitors per annum, the majority of whom are families there to use the beach and who may have only a passing interest in the dunes and the Nature Reserve. Nonetheless 8,000 of these visitors are students involved in GCSE, A-level and even degree level studies involving the Nature Reserve and the dunes.
The area is evidently a honey pot for tourists with its scenery, beach and accessible car park. Clearly summer will be the peak season when tourists visit the bay. At that time the size of the car park is unlikely to deal with the influx of vehicles and parking on verges is likely to be problematic to traffic flow and damaging to the local flora. Direct damage and the polluting exhausts will both affect the flora. The roads cannot be developed or improved without affecting the Nature Reserve.
Economic effects on the area
Tourists bring advantages and disadvantages when visiting the area, as discussed below.
Advantages
- Tourists bring in a lot of money to bed and breakfast’s, hotels, gift shops, café’s etc.
- Provides jobs for hotel and café workers etc.
- There is also the multiplier effect where
more money from tourists = more jobs = people have higher incomes = they spend more money = the economy of the local area improves.
- Money can be used in village improvements and activities.
- Money can be deployed to the Reserve and to warden care.
- As tourists visit the Bay, the NCC makes sure the place is always tidy.
- Tourists also bring a lively atmosphere that attracts more tourists and future residents.
- The village can grow with the success and money and support more local services that all can gain from.
Disadvantages
Seasonality means that for half of the year very little money is coming into the area from tourist activity.
- Other outlets bring in less money than tourism, do not develop and cannot make up the deficit for the rest of the year.
- Tourists also cause noise, litter, and air pollution and bring their city attitudes to the area.
- If the economy of the area improves too much this might escalate environmental problems.
- Second homes in the area restrict use by local residents, particularly by raising purchase prices.
SECTION 3
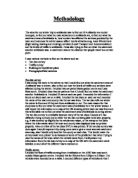
Methodology to assess how the area is managed
During the recording of data on the various footpaths, note was also taken of any management techniques used in the dunes to prevent damage from tourists and to prevent erosion. In addition class based study was undertaken together with research on the Internet to consider management techniques, their use and their relative success.
To achieve primary data
- Whilst at the activity centre (Ramfield) carry out a brainstorm on all the possible management techniques that you might expect to find at Oxwich Bay to reduce the tourist impact and protect the dunes ecosystem.
- With these ideas in mind tabulate a brief description of how one might think the techniques work.
- During site observation try to find one example of each of the management techniques, note the location and take photographs where possible.
- Finally undertake a cost benefit analysis table to compare the different techniques on merit and cost, to assess the most appropriate ones for preserving the dunes.
To achieve secondary data
Internet sites visited were those listed in Section 2 and these supplied a little additional data on the bay, the reserve and its management.
.
Results of management techniques appraisal
The diagram illustrates the management techniques that came out of the brainstorm.
Cost Benefit Analysis – Management Techniques
Many people, for example businesses and government departments, use a cost benefit analysis. Geographers commonly use this technique; it is used below for comparing different ways of management in the Reserve at Oxwich Bay. Cost and benefits are considered in the analysis. Benefits are not purely financial, but are also considered environmentally or even socially.
A scheme mark was estimated on a scale of 1 to 10 against expected relative cost and benefit.
A high mark was given for the lowest cost and for the maximum benefit.
Subsequently for each management technique the score was added for cost and benefit, the higher the total score then the “better” the technique i.e. it has more benefit and less cost.
Cost Benefit Analysis –Dune Management Techniques Table 3:1
Analysis of Results
The management techniques are discussed in the order of maximum cost benefit as shown in the table of results, Table 3:1, above. The thought process in arriving at the ratings is shown below for each technique.
Signs
- Comes out top with cost benefit rating of 15, equal with fences.
- Very useful because they inform people generally about the dunes and their importance.
- Usually placed at entrance or in the slacks for maximum effect at access points..
- Provide useful information about the history and nature of the ecosystem in the dunes and its sensitivity, to alert people to avoid damage.
- Tells people how and where they can or cannot walk and routes i.e. a map of footpaths and access times.
- People can be receptive to signs and information.
- Very sustainable, they can last a long time.
BUT:
- Some people do not read them or will ignore their instructions.
- Cannot be placed everywhere where people enter the dunes.
Fences
- Comes out top with cost benefit rating of 15, equal with signs.
- Found at front of dunes for maximum restriction of beach users.
- Also found at dune slacks.
- Means more protection so vegetation can grow undamaged.
- This in turn helps protect the food chain.
- Fences stop trampling and erosion in sensitive areas.
- Fences are cheap to erect from sustainable sources and repair if damaged.
- Sustainable, they last a long time.
- More people will tend to take notice of fences rather than signs.
BUT:
- Some people ignore fences by climbing over them.
Bins
- Third in cost benefit rating, score of 11 marginally less than fences and signs.
- Provides place for tourists to deposit litter.
- Helps environment because less litter means less poisons to get in the soil to affect the vegetation.
- If people see the bins they will be encouraged not to drop litter so the area will stay protected.
BUT:
- There weren’t any bins on the dunes and they can be unsightly.
- Only one bin next to shops therefore relies on people to take litter with them.
- Bins may solve some of the litter problem but not the trampling and erosion problems.
Horses
- Overall fourth on the cost benefit scale equal with bins, score11, again just marginally less than signs and fences.
- Horses are an effective way to combat overgrowing plants and particularly bracken, which is good because bracken is a type of plant that doesn’t allow other plants to grow.
- They fertilise soil with faeces.
- They can be a tourist attraction.
BUT:
- They also trample other vegetation and cause erosion if left to roam, which defeats the object.
Wardens:
- Wardens had a balanced cost and benefit grades of 5, and a total of 10, marginally lower than bins and horses, which is placed five out of eight.
- Wardens do have an education value and inform people about the ecological value of the dunes its vegetation and its animals.
- Very useful to tell people to move off the dunes and to stay off certain areas.
- Local people may be employed as wardens, which can provide jobs for local people.
BUT:
- Wardens are expensive unless voluntary.
- Difficult to employ as many as would be required at the height of the season.
Re-Planting Marram Grass
- Also has a total benefit of 10 placing it fifth overall and also slightly lower than bins and horses.
- Marram grass is planted in winter by helpers and or volunteers on the dunes.
- The following summer the marram has established, so quick results.
- It helps to hold the soil together and stop wind erosion so helps protects the dunes.
BUT:
- Sometimes the marram grass can be trampled before it has the chance to grow.
- It can also be uprooted, blown away.
Widening Paths
- Widening footpaths is ranked sixth overall, because its total cost and benefit is only 7, 3 marks lower than wardens and re planting marram grass.
- People would stick to the wider paths because tourists are likely to be able to see them easier.
- Can result in less erosion on either side of the path.
- Blowouts do not get eroded.
- Very sustainable because widened footpaths should last a long time.
BUT:
- Will wider footpaths be able to make tourists stick to them, the study suggests not and that it might encourage more access
- Might be most useful when used in combination with signs and fences.
Watchtower
- The lowest of all with a mere 5 cost benefit score and is placed last.
- An ineffective way to stop people wandering aimlessly around the dunes.
- Costly to build and unlikely to have more than one, perhaps two.
- Does not directly stop the trampling problem caused by walkers.
- Requires someone to be present
BUT:
Summary of the pros and cons of management
As you can see from the table (Table 3.1) there are eight possible management techniques in the cost benefit analysis.
The highest total amount scored for benefit and cost was fifteen. The two schemes that acquired this were signs and fences. I marked these schemes like this because both are inexpensive to create, so I gave signs a mark of 8 and fences a mark of 9. Both these schemes also incorporate significant benefits, it was felt people would respond to such signs that inform and also instruct where people could walk, whereas fences are more direct and provide a barrier to people. I thought that the additional information from signs should have a slightly higher benefit. You could also use both signs and fences in conjunction to provide maximum benefits.
The scheme, which I scored, lowest was the watchtower, which I was surprised by. The reason it was worst was that the watchtower could easily be ignored and would mean employing extra people to man it. The benefits are very small because they are expensive to maintain even though they are reasonably cheap to install. With this in mind I marked the watchtower for costs only 3 and benefits only 2.
The management scheme second to least cost was planting marram grass, its costs only four marks, this is because once the marram grass has been planted it will reproduce so therefore it will last a long time and is sustainable.
The scheme, which had the most benefits, was installing signs. They can be a very effective in informing people where they can or can’t walk.
Human problems and solutions
- Trampling is a problem. Fines, signposts, electric fences and normal fences could be a solution to the problem.
- Litter is a problem. This can be resolved by a litter picker or by having more bins and possibly signs as reminders.
- When tourists have money but have nowhere to spend it is another problem. The obvious solution would be to open an info centre or a tourist shop or more of them.
- Lack of information is a problem. To solve the problem leaflet, stands and signposts could be put up.
- Not sticking to footpaths is a major problem. To make people walk on them more could be made, make them more visible and make them wider.
Physical problems and solutions
- Wind erosion is a physical problem. By planting more marram grass it can be resolved.
- Blow out. Resolved by putting more sand in the blowouts place. Use signs to tell people not to walk there.
- Heather and bracken. Bring horses or mow it down to get rid of.
- Scrub and weed. Again mowing can resolve this problem.
- Sea erosion. Groins can be put up to resolve this.
In summary, in our study at Oxwich Bay we have considered the following hypothesis carefully,
“Tourists are in conflict with the sand dune ecosystem at Oxwich Bay Nature” Reserve.
We have done this by obtaining lots of information on the Sand Dunes and Area with geological surveys and many different tourist surveys. We have also obtained information through Internet searches for tourist’s results.
Prior to this we sectioned the information into three specific areas or sections
- Section 1 looked into the condition of the dunes by taking of the transect tables and reviewing soil and vegetation cover.
- Section 2 involved consideration of the impact of tourists on the dunes, for example the way the footpaths are trampled, and on the area in general.
- Section 3 reviewed the management of the Bay and what has been done to help the Bay’s ecosystem.
Section 1 was the longest section of all. It includes a brief introduction to the project starting with the hypothesis in question, the location of Oxwich Bay and background to the area. Section 1 also includes how the dunes are formed, exploring the Embryo dunes, Fore dunes, Yellow dunes, Grey dunes and the climax community.
Section 1 also entails the discussion of methods by which the group collected their data on the dunes. This data included marking out the dune transects from the start of the dunes up to fifty metres. I have also included an analysis of these transects and included graphs to show and examine relationships between slope angles; soil and vegetation cover, amongst others.
Section 2 took a closer look at the environmental side of the dunes, looking at how the dunes can be affected by many different factors, such as trampling and litter, with a close analysis of the way in which these affect the dunes. With trampling taking place, in turn will affect the amount of producers in the food chain; can mean fewer habitats for species such as small mammals, resulting in less primary consumers.
However the Section moves off of the subject of the dunes and looks at the local area surrounding the Oxwich Bay nature reserve. The impact of tourism, how the area is a honey pot for tourists and looking at the traffic congestion and social and economical effects, were all assessed.
Section 3 entails the management side of Oxwich Bay talking in more depth about how the sand dunes are managed and the nature trusts efforts to combat tourisms impact on the area. The group first undertook a brainstorm of management techniques they could think of. I have also included a cost benefit analysis table to mark the costs and the benefits of the techniques, to assess best value. I have also looked in detail at the management techniques used by describing how each one works and why it’s used.
With this data recorded down into three sections I noted that there were many limitations for recording the data, which I have stated below.
It was not peak season and there were not that many people or cars, therefore we couldn’t carry out the questionnaire properly and the car park survey was of limited value.
Didn’t visit enough sites; seeing as the Bay is 4 square miles our results may not be representative.
We talked about the features of the roads of Oxwich Bay. It would of been better if we took photographs or drawings to describe this in further depth.
Draw a map to show where management techniques are.
Could of taken photos of management techniques.
We visited out of season therefore not seeing all management techniques.
Had lack of information about management techniques therefore cost benefit analysis less realistic.
Speak to NCC directly, or warden, to find out more about management techniques and see true cost and benefit in relation to desirable effects.
Investigate further about original ideas on how to preserve the dunes.
Considering the hypothesis I have come to the conclusion that it is blatantly wrong. I think this because there is just not enough evidence to back up this hypothesis. Further data gathering at different times of the year however could alter this view.
It is easy to disagree, because of many things. One could say that Oxwich Bay is a vast expanse of land and that the amount of tourists visiting the Bay could not affect it at all. I think this because at the time of our visit, it was not peak season, and there was no one in the Bay at all. However you could say that there is a conflict at Oxwich Bay that occurs because tourists are clearly walking around the dunes, but there is no major conflict that could escalate into the environmental collapse of the dunes.
With this in mind one could say that maybe the Bay is only affected during peak season when more people are inclined to use the bay thus, meaning if most plants are damaged in this time there is plenty of time for plants such as marram grass to re-grow.
One can see how the conflict could be happening with the extent of the people involved with the dunes who have completely different opinions and development ideas for the dunes.
The environmentalist factions, whilst only wanting to keep the dunes intact, try to keep the dunes isolated for users and tourists. There is a great contradiction with the environmentalist’s protection of the bay because the managers want to grant proper controlled access to the dunes for all interests. Sustainability of the management is also at issue. Residents in the area are neutral, only keeping the best welfare of the dunes at heart and benefiting from the beauty of the area.
The dunes may be at other more significant risk, from sand depletion caused by dredging offshore.