Conclusion:
More people are to be found where there are major chain stores (in the centre of the CBD), and the land values for the centre of the CBD are higher, in relation to the higher number of people who visit them.
This leads me onto hypothesis three, as the number of pedestrians may affect the shopping quality and street appearance of the streets.
Source: www.rotherham.towntalk.co.uk
Hypothesis 3
Shopping quality and street appearance deteriorate away from the centre
We decided to investigate this hypothesis, because we wanted to see whether the street appearance and shopping quality was affected by the number of people who shopped in the area, and by the type of stores that were there. I wasn’t sure what to expect beforehand, because I thought that more people in the centre of the CBD would make the street appearance and shopping quality deteriorate, yet I also thought that the street appearance would have been maintained by the council throughout, and the shopping quality would have been maintained, so that the shops reputation was improved.
To investigate this hypothesis we wrote down ten different streets we would use on a map of the town centre, and numbered them 1-10. We varied the streets from the centre to the outskirts of the town. Each street was given a score out of five (five being the lowest score and one the highest) for each of the 10 categories, giving a total points score of 50. The list of categories and their equivalent point scores can be found on page 13
The categories A – D and E – J were added together to make the total scores of shopping quality 20, and street appearance a maximum of 30 respectively. The scores I gave for each street can be found on page 14.
The final scores were placed on a composite bar chart on tracing paper, above the map telling us which streets we used. This can be found on page 15.
When we were making judgements about the street we did not always agree and had to compromise, before we could make a decision about each score. This means that our results could be flawed. This was rare though, so as with the last hypothesis, we would be able to tell if we went wrong, because anomalous results would appear on the map.
Findings:
The composite bars on the map are much bigger along the outskirts of the town. This shows that the shopping quality and street appearance do deteriorate as you leave the centre of the CBD, in our opinion.
When premises were empty, mainly on the outskirts of the CBD, we found them to be extremely unattractive with graffiti and with boarded up windows and tiny fragments of broken glass surrounding them. This amount of empty units could be linked to the growth of shopping areas such as Meadowhall and Retail World, and the demise of department stores in a CBD, on smaller businesses. It could also be linked to the fact that fewer people shop here because some of these streets looked more unattractive.
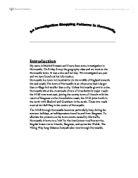
Upper Howard Street by far had the best shopping quality and street appearance, almost getting a perfect score (it got 11 and the best a street could get was 10). This obviously was because it had extremely good shopping quality (with a bustling market to throw in as well), and an equally good street appearance. The only problem with it was that it had bits of litter on the floor.
Church Street (below) had the worst appearance in our opinion. Many things contributed to this:
- Parked cars on the pavement despite double yellow lines down both sides
- No pedestrian crossing even though this street is not pedestrianised
- Scaffolding along a large proportion of the street
- Noise pollution causing disturbance to people on the street (and others), from building work
- Tall buildings blocking some natural sunlight
Conclusion:
The fact that more people visited the central streets did not have a detrimental effect on the quality of the appearance of the streets or shops, as we found these to be safer, cleaner, and with shops that were maintained to a high standard.
Up until now:
So far, we have seen a very clear pattern…
Firstly, we have seen that the centre of the CBD homes a higher density of chain stores, because more people are found in the centre of the CBD. We have also seen that this increases the land values of the shops in the centre of the CBD. We also know that areas of a CBD have a generally better shopping quality and street appearance, which could be why more people are attracted to this area.
On the outskirts of the CBD, we have noticed that it homes a larger number of stores that provide services and low-order goods. We can link this with the demise of the shopping quality and street appearance, and the smaller number of people who visit, as the centre of the CBD needs to maintain the number of pedestrians it gets by maintaining it’s much higher standards.
Hypothesis 4
Rotherham attracts people from within the Rotherham metropolitan Borough
Rotherham has very good links with other cities and towns via. motorways and A-Roads, as I mentioned in the introduction to Rotherham. It also has a large bus complex on Corporation Street, and train links nearby. Because of this, we decided to investigate whether Rotherham attracts people mainly from within its borough, or if its accessibility had an impact on its visitors from further away.
To investigate this hypothesis our group devised a questionnaire to survey shoppers. We presented these as attractively and simply as we could and asked these questions to random people on the street. We added extra questions, for if we decided to investigate other things in relation to this, such as the method of transport used, to see if many people took advantage of the bus networks, for example.
We were careful how we approached the public so that we could get the required response, but still, we had a large problem, because a lot of people declined to take part despite this.
We approached people mainly in the centre and wondered if we had varied the streets if we would have received a similar response. This would be one of two flaws we could have had in the survey. Because we surveyed people in the centre of the CBD, I am wondering whether we got a biased response from people who were looking in the area with a high density of chain stores, and not areas with a higher density of low-order goods stores, and shops providing services.
The other flaw is that we couldn’t visit each area at different times, because of the time limit we had. It would have been interesting to see whether the time of week or day had an impact on where people travelled form to get to the area, e.g. in the weekend, more people may have come from further away to have a browse.
The information collected is on different graphs – these are on page 17:
Graph 1 This graph shows where people came from. All the people we surveyed came from within the Rotherham Borough – in other words, we have proved hypothesis four to be correct (as long as any flaws haven’t affected the outcome).
Graph 2 This shows how often people shop. The results inline with graph one seem to be correct, as everyone we surveyed didn’t have to travel very far to get to the CBD. Therefore, more people have the option of going every day.
Pie Chart 3 The most people here either came by car or public transport (6 out of 16 each). This shows that the large bus station IS in fact being taken advantage of, only by the people within the RMB, and not by people further away.
Graph 1:
Graph 2:
Pie Chart 3:
Conclusion:
The people we surveyed were from within the Rotherham Metropolitan Borough. This suggests that despite its favourable location and transport network Rotherham is failing to attract visitors from other areas to its CBD. Perhaps this could be due to the close proximity of Meadowhall and Retail World at Parkgate being too strong competition.
Parkgate Retail World
Map source: www.streetmap.co.uk
Retail World at Parkgate is situated approximately two mils from the CBD of Rotherham, and was established approximately 20 years ago.
The layout of this retail park is significantly different to that of the CBD. It forms a quadrangle of shops, with the hollow part in the middle forming ample parking. This forms a convenient shopping area, whereby you can park near to the shops where you want to go to.
I intend to investigate two hypotheses, which are similar to two of the hypotheses we conducted at Rotherham CBD, so that I can compare the two separate types of shopping areas.
However, the different areas aren’t ideal to investigate, as they are so close to each other. It will mean that, for example, that shoppers will only want to visit one area instead of both, so any questionnaires distributed will be biased upon only the shoppers who choose to go to Parkgate.
Hypothesis 1:
The natures of retail units are different to those of a town centre
I wanted to investigate this hypothesis to see whether the natures of retail units are any different to those of a town centre. Beforehand, I was expecting them to be different, because there aren’t as many stores, which would have to be made up for in having lots of chain stores to attract visitors. Also, the much larger sizes of each shop would attract more businesses, because they could fit a lot more into one of the plots, therefore generating competition between businesses.
The CBD of Rotherham comprises of quite a few chain stores, but also has a number of shops providing services, and shops selling low-order goods. At Retail World, it was possible to name each unit, whereas in Rotherham CBD, this would have been difficult, as there were many more stores, and a tight time limit to finish the exercise. It would have been interesting to compare the different chain stores, and see if the shop types are any different to those in the CBD.
If we had compared the sizes of the units available in both areas, it is likely that we would have found that the town centre plots wouldn’t have been suitable for the stores we found in Parkgate, because the stores in Parkgate were a lot bigger, of which most of their space had been used. Daewoo would have been the perfect example, because it would have been difficult to get all the cars in a small plot, even if it was reasonably sized.
Also, the transport amenities are very different. In Rotherham CBD, there are good public transport links, with a large bus station within metres of the centre of the CBD. However, Parkgate doesn’t have the same extent of public transport links within close range of the retail park (it only has a few bus stops scattered around the complex entrances).
However, the car parks at Parkgate are much more accessible than at the CBD. Parkgate has it’s parking facilities within the quad shape I forms, so as I’ve said, you can park next to the area you would rather shop at, and virtually be at its entrance supposing it isn’t too busy. In contrast, Rotherham CBD is spread over a number of more randomly placed streets, and although there are pay and display car parks spread around, they aren’t as immediate as the Retail World parking facilities.
To investigate this hypothesis, we went to Retail World, and put the name of each shop on a map, and then putting them into different categories according to the products they sell. I found this a lot easier to do than in the CBD of Rotherham, as all the units were occupied, and it was much clearer to see the types of goods that they supply. The map I completed can be found on page 23.
Here are all the shops at Parkgate, along with the category they fall into (on the next page):
Although there are fewer shops at Parkgate, there is a much higher density of chain stores. In order to analyse this information more carefully, I have decided to include a tally chart showing the percentages of each specific group of shop type:
I have also converted this table into a doughnut graph:
From this, we can say that clothing and electrical stores dominate Retail World, because combined own 35.7% of all the units (17.85% of all units each). Home and furnishings also ranks highly with 14.25% of the units. However, we can’t compare this data to that of the CBD of Rotherham, because we didn’t collect the shop types that it had.
From the map, we can see that the shop types with higher densities tend to be located near to be each other. It is possible that the customer could benefit from this, as competition would almost certainly occur between then, making prices of goods cheaper to attract customers to a particular store. It would also help customers compare prices at different stores, to help find a ‘bargain’ product.
This would make it a disadvantage to stores that haven’t got competition, such as Staples or Daewoo. This is because customers are less likely to make a decision to purchase an item after only looking at the product in one shop. This would be particularly bad for stores which don’t sell that many items, such as Daewoo, who obviously wouldn’t sell as many cars, as they generally aren’t needed to be bought as often as most other things which are sold at Parkgate Retail World.
Conclusion:
It is clear to see that there are differences between a Retail Park and a CBD, as I have explained. Whether it be because of the obvious points, such as: the differences in sizes; or the amount of stores within each area, or the less obvious points, such as: a higher density of chain stores in the retail park; or the differences in parking facilities and public transport links, there are many differences between them.
The fact there is a higher density of chain stores leads me onto hypothesis two, because I am expecting people to travel from further away to browse over the wider selection of chain stores…
Hypothesis two:
A retail park attracts people from a wider area than a town centre
We chose to do this hypothesis, so that we could compare the distances shoppers are willing to travel to get to Parkgate and to Rotherham. Beforehand, I was predicting that people would come from a wider area to Parkgate, because of the much higher density of well-known chain stores it has to offer, and also because of the larger stores it has to offer (see hypothesis one for Parkgate).
We decided the best way to investigate this hypothesis was to use a questionnaire, very similar to that of the one we use in Rotherham CBD. The only difference was in question one, when we changed the reason why people went, because there were no services or low-order goods stores to broaden the range of activities you could do there. The possible answers now are: ‘browsing’, ‘minor purchase’ or ‘major purchase’.
I surveyed 10 different people, and as with my Rotherham CBD survey, I added extra questions so that I could investigate how and how often people came to Parkgate, as well as where form.
There were no problems that we had on the trip, except for the fact that I had a tighter deadline to meet, meaning I had to survey people quicker. Even though I did this, I didn’t manage to survey 16 people like I did in Rotherham.
This is the only way in which I could flaw my data, but to compare the data, but I can deal with this problem, and explain how the data/graphs would look supposing the no. of people surveyed were the same.
Here is a list of transport links, and a tick next to whichever one I think is most convenient at each, with a reason specified next to each:
This shows that I think that Parkgate is suited more to people who drive cars to travel, and that Rotherham CBD is suited more to people who want to walk and go by bus. Therefore, I am expecting that people from further away are more likely to go to Parkgate, because people would feel comfortable in going a long way by car, whereas people wouldn’t feel as comfortable going further away by public transport and by walking.
Findings:
Although Rotherham CBD has a better transport service overall (with much better public transport links), it did not attract from as wider area as Retail World. Rotherham again attracted the, most number of shoppers (40%), Barnsley attracted nearly as many (30% of visitors surveyed), closely followed by Sheffield (20% of people surveyed), and Doncaster (10% of those surveyed). No one came from outside of South Yorkshire. This data is represented by the graph below.
In the next graph, I have put the results into a composite area graph (putting the total no’s. of people into an area):
This shows that, in total, the majority of people travel to Rotherham CBD and Parkgate from within the metropolitan borough. It also shows the distribution of how the total no. of people were distributed between Rotherham CBD and Parkgate. As I’ve explained, everyone who I surveyed in Rotherham CBD came from Rotherham, whereas the people who I surveyed in Parkgate were more evenly distributed between the four towns that make up South Yorkshire.
The next graph below will tell me whether my theory of transport methods is correct. The graph is another composite bar chart. If my theory is correct, then more people should have travelled by car to Parkgate, but more people will have used public transport and will have walked to Rotherham CBD…
This does show that my theory is correct, because the yellow bars under ‘public transport’ and ‘walk’ (representing Rotherham) are larger than the orange bars under ‘public transport’ and ‘ walk’.
However, with ‘car’, the bars are very similar. Although the orange bar representing Parkgate is larger, it is much more of a tight call. However, I haven’t taken the different numbers of people that had been surveyed into account (the potential flaw in the data). In other words, if the totals of each area were represented by percentages and not the values, the difference between the sizes of the blocks (the percentages of all the people who drove to Parkgate and Rotherham) would have been much larger.
Conclusion:
People come from further away to visit or purchase items from Parkgate. I have also proved that there is a relationship between this, and the transport methods used as a sub-hypothesis.
I will now go on to investigate an out-of-town shopping centre – which will be Meadowhall. I will investigate it individually, and also compare it to Rotherham CBD and Parkgate Retail world.
Out-of-town shopping centre – Meadowhall
Meadowhall is in the top left-hand box. It is very close (less than a mile away) to J34 of the M1. This gives it easy access to anyone who lives close to the M1, e.g. Anyone in Barnsley who lives near J36 or J37. It also gives access for anyone near to a junction of the M18, because there is a motorway interchange joining the start of the M18 and the M1 J32 together (in the bottom middle box).
The A6102 and the A6178 give nearly direct access to Meadowhall, from a westerly direction. This gives access to people from Sheffield. Some of the roads in the Rotherham A-road network (as mentioned in the Rotherham location description) also lead to Meadowhall, because they lead to J34 of the M1 as well. Examples of these roads are the A6164 and the A6138. This will mean that access to Rotherham is fairly easy, as well.
Meadowhall in Sheffield was opened on 4th September 1990. It is situated three miles northeast of Sheffield and the site is an ideal location as it has nine cities all within an hours drive away. These cities are: Leeds, Nottingham, Wakefield, Manchester, Hull, Leicester, Barnsley, Doncaster and Rotherham. An overhead view, along with the basic exterior plan of Meadowhall, can be found on page 29.
The final part of my investigation will focus on the out-of-town shopping centre, Meadowhall. Since about 1980, the biggest change in retail has involved the growth of shopping centres like Meadowhall, as I will explain later. Meadowhall itself has now become so popular, that the M1 had to be redesigned near J34, so that people who are pulling off at that junction must be in the first lane a long time before, simply to prevent traffic congestion, particularly at Christmas time.
Some of the reasons for building Meadowhall out of town are:
- It is situated on a motorway interchange, which provides easy access.
- There is plenty of open space for large car parks, so there is less traffic congestion or parking problems.
- Land values are much lower than those of land values in the CBD of Rotherham.
- There is space for expansion, unlike in the town centre.
- It is near housing estates, which will provide a suitable workforce.
It appears that the empty shops in Rotherham could be because they have relocated to Meadowhall, where rents are cheaper, or because they could no longer compete with the growing popularity of the out-of-town shopping centre.
I am going to investigate Meadowhall based upon similar hypotheses to that of Rotherham. Therefore, I will be comparing the two, and Parkgate, on: the distribution of chain stores etc., the distribution of shoppers in the areas, the shopping quality and street appearance, and the areas for where people come from.
After doing this, I will be able to draw conclusions upon the patterns of the retail industry.
An overhead view of Meadowhall:
A plan of the Meadowhall exterior, with car park plans and nearby roads:
Hypothesis 1:
There are more chain stores and specialist shops selling high order goods than in the CBD
We found that Rotherham CBD was dominated by chain stores in its centre, and shops providing services; and shops selling low-order goods on its outskirts.
To investigate Meadowhall, I drew a plan of the lower and upper floors, based upon the ‘Meadowhall’s Christmas Map’ (in the appendix). I did this in much the same way I did in Rotherham, by using a key, and colouring in each plot depending on whether it was a chain store, a shop providing a service, or a shop selling HIGH (not low) order goods.
The only problem I encountered was distinguishing between some high order goods stores. Some stores which I put down as high order goods store may turn out to be chain stores, because I am not sure whether there are other branches of the store elsewhere. This was particularly a problem with the numerous chain stores on the upper floor. This is the only way in which my results could be flawed.
Findings:
Meadowhall had only four empty units compared to ten within Rotherham CBD. The stores in Meadowhall that were empty were being rebuilt into a different store, whereas the ones in Rotherham CBD weren’t. This obviously shows that the stores in Meadowhall are more popular than those in Rotherham CBD. Services as Meadowhall are mainly located in one area, called the Oasis, while in comparison, the CBD has many more shops providing services, which are spread over a wider area (see map of CBD, page five).
Chain stores dominate Meadowhall (see Meadowhall map, page 32 for the lower floor, or page 33 for the upper floor) and there is a larger amount of stores selling high order goods on both floors.
Conclusion:
Out-of-town shopping centres such as Meadowhall appear to have more chain stores and specialist shops selling high-order goods than of the CBD in Rotherham. There are more services in Rotherham CBD, though, and they are spread over a wider area.
*On page 31, there are graphs showing the number of each type of store in Meadowhall.
I have done two lines (one with the Oasis included and one without), because the areas are heavily filled with services and high-order goods stores. The area called ‘The Lanes’ has nearly 50 high-order goods stores, of which wouldn’t be found if that small area didn’t exist. The rest of the area consists of many fast food stores and restaurants, which I felt wasn’t fair to be counted as different shops, as there is barely any variety in the different stores which were there.
The graph below shows the number of stores of each type on the lower floor. This floor is where ‘The Lanes’ are located, and it shows! The graph overall shows that chain stores dominate the lower floor, and that high order goods don’t dominate (supposing that ‘The Lanes’ aren’t included). It also shows that the services wouldn’t dominate, whether the stores in the Oasis were included or not.
This graph shows the same thing, except for the upper floor. This graph shows much the same thing, whereby chain stores dominate the area, but the range between chain stores and the number of high-order good stores is significantly less than that of the first floor. Again, it shows that services wouldn’t dominate, with or without the Oasis stores included.
Hypothesis 2:
There is a more even distribution of shoppers
Our pedestrian survey of Rotherham proved that the larger streets with a high density of chain stores attracted more people. From this I presumed that the distribution of pedestrians at Meadowhall would be more even to match the even distribution of chain stores, which I know there are because of hypothesis one.
To investigate this hypothesis I carried out a pedestrian survey at Meadowhall, the same as the one we did within the CBD of Rotherham. I chose five locations on each of the two floors to count the pedestrians for three minutes.
I used a tally chart like I did with the count I did in Rotherham. This can be found on page 36.
Because I was conducting this survey by myself it was difficult to count, and keep a written tally at the same time, as there were so many people. I decided after the first count I did to stop tallying, and to count in my head, because it was harder to look down and at the pedestrians walking by at the same time. The fact that I could only carry out this survey on a Saturday may account for the large amounts of people I encountered, because more people, students particularly, will have had the opportunity to go during the weekend.
These points could have flawed my results if I was looking for a direct comparison of numbers of pedestrians, and it is more possible that I could have slightly miscounted, so the numbers on the chart may not be exactly correct.
Findings:
I produced a scatter diagram of the results, using my tally chart as a guide. This can be found on page 35
I was looking at the distribution of pedestrians throughout Meadowhall and when I compared my findings to those within Rotherham CBD it was clear to see the difference. With the exception of High Street (outside of Regis) and High Street (outside of USC) all the other streets have very similar amounts of pedestrians. In fact, not including those two results, the range was only 69, which was actually less than the range than of Rotherham CBD (above 150), which is especially even to say more people walked past than in Meadowhall.
Conclusion
The streets in Meadowhall do have a more even distribution of pedestrians than those in the Rotherham CBD.
If the distribution of pedestrians is even, and the different types of shops are evenly distributed, then I would expect the shopping quality and street appearance to be similar throughout the complex to suit this trend. This leads me to hypothesis three…
A scatter diagram, showing the distribution of pedestrians in Meadowhall:
Hypothesis 3:
Shopping quality and street appearance is similar throughout
Considering the large numbers of pedestrians in Meadowhall, I would expect this to have an impact on the shopping quality and street appearance. However, within Rotherham CBD, we found that where the streets were pedestrianised (i.e. a dominance of chain stores), the shopping quality and street appearance was good, even though there were more pedestrians that could ruin the area (e.g. litter more).
Because of this, I was expecting the shopping quality and street appearance to be similar throughout the complex, to suit the trends of where chain stores etc. are distributed, and how pedestrians were distributed throughout Meadowhall – evenly.
To investigate this hypothesis, I chose 10 different locations on 10 streets (fine on the lower floor and five on the upper floor), and gave each a score out of 50. This is the same as I did within Rotherham CBD (see page 11). The sheet with my scores on it can be found on page 40.
The streets I used were:
The fact that I used the same question sheet (on page 39) as with Rotherham CBD meant that Meadowhall had an advantage. I wanted to use the same question scheme so that the tests I did would be fair. On the sheet, I have put blue lines over three sections, because they will have the answer of 1 throughout. These are: E – safety for pedestrians crossing street, because every street is pedestrianised; F – shopping crowds, because I've already proved that every street was very busy; and I – traffic/pedestrian segregation, again because every street is pedestrianised.
Overall, there isn’t a way in which my results could be flawed, despite having the problem I described in the last paragraph, because I have made it identical to the test I did in Rotherham CBD, and the problem of arguing over scores wouldn’t have arisen as I did it on my own.
Findings:
The scores that I got were mainly what I was expecting to find. All the streets scored with either 1’s or 2’s, with the exception of the odd category, meaning that no shop scored above 20 overall.
The hypothesis is correct, because the range of all the scores is only 4 (17 – 13). This means that all the point’s scores are very similar, especially when you think that the scores were (overall) out of 50.
However, I wasn’t content with finding the range, so I found the standard deviation of the scores. This can be found at the bottom of this page. Basically, all the calculations are telling me that 67% of all the scores (between six and seven scores) were all within 1.47 points of the mean, which was 14.2 points. Again, this is especially good, considering that the points were out of 50.
To make my results more accurate, I could have got a second opinion, or compared my results with what other people generally found. However, this is my opinion, so this wouldn’t have been so important to have.
Standard deviation of the figures (see findings, paragraph two):
S.D. = √ ( Σ(x – x) ÷ n ) = √ (the total of (each value – the mean) ÷ the number of scores)
So… The mean (x) = 142 ÷ 10 = 14.2
This means that Σ(x – x) = 21.6
S.D. = √21.6 ÷ 10 = √ 2.16 = 1.469693846
This means that 67% of all the points scored were within 1.47 points of the mean (14.2).
Conclusion:
The shopping quality and street appearance are similar throughout the complex.
Hypothesis 4:
Out of town shopping centres attract people from a much wider area than Rotherham or Parkgate
In my introduction to Meadowhall (page 27), I outlined some of the reasons for the location of town shopping centres. It has six major car parks, a motorway interchange close-by, within close range of nine different towns/cities, and generally has good public transport links.
To investigate whether Meadowhall attracts people from a wider area than either Rotherham or Parkgate, I carried out the same survey as I did with Parkgate (except for where the word ‘Parkgate’ has been altered to ‘Meadowhall’). Because I didn’t have a time limit, I could get 16 people to survey, unlike with Parkgate, meaning that I can make direct comparisons between Rotherham CBD and Meadowhall.
However, the main question to ask (which major town are you from) wasn’t quite suited to my survey. This was because the answer ‘other’ covered every other area apart from South Yorkshire, meaning that it wasn’t specific enough. However, I'm not too concerned about this, as this question remained the same throughout, so it is still possible to make direct comparisons between the three different areas.
Overall, there is no way in which this survey could be flawed, because all my data came from the public, meaning that my data wasn’t based upon facts, but upon what they told me.
Findings:
*Graphs 1 and 2 on page 42; and graph 3 on page 43
From graph 1: This shows where people travelled from to get to Meadowhall. It’s obvious to see that the majority of people I surveyed came from Sheffield. I was expecting this, as Sheffield is very close to it. 25% of those surveyed (4/16) came from a place outside of South Yorkshire, which was twice as many as Rotherham, Doncaster and Barnsley. This took me by surprise, as I was expecting people from further away to be visiting other out-of-town shopping centres, such as Trafford Park, or White Rose, which is close to Manchester and Leeds respectively.
From graph 2: This shows how many people travelled from each place, to Rotherham CBD, Parkgate and Meadowhall. This shows that Rotherham was collectively the place where most people travelled from, but only because of the high amount of people who travelled to Rotherham CBD from Rotherham itself. Sheffield was collectively the second most popular area to travel from, Barnsley was third, others was fourth, and Doncaster was the least popular place to come from.
From graph 3: This shows how people travelled to get to each place. It shows that all three have a high percentage of people who travel by car. This is because they have overall better parking facilities than Rotherham (they are both large and convenient). It also shows that the public transport facilities of Rotherham CBD and Meadowhall are used, as they hold a fairly high percentage of how pedestrians travelled, compared with Parkgate whereby the percentage was very low. It also shows that in all three places, that travelling by bike or by walking is the least popular way of travelling.
Graph 1:
Graph 2:
Graph 3:
Conclusion:
The areas where people travel from to get to Meadowhall are much more varied than that of Rotherham CBD and Parkgate (i.e. having a more even distribution of the number of people travelling from each place). This means that this hypothesis correct.
An overall conclusion is on the next page…
OVERALL CONCLUSION:
The pattern of the retail industry is changing. Meadowhall and Parkgate Retail World appear to be thriving, in that higher numbers of people from the surrounding area visit them at regular intervals. Rotherham Town Centre, however, is a different story. Council Leader Mark Edgell, in a recent interview for Rotherham Advertiser (which is in the appendix), said:
“The town centre is struggling because it is competing with Parkgate and
Meadowhall. We can’t do what they would do better than they do”
(From 17th January 2003)
This sums up what is happening, and shows us that the problem has been recognised by the RMBC.
However, this decline may change. This is because, under the scheme Yorkshire Forwards, Renaissance Town Programme (a panel of experts) has been drafted to help show the way back to prosperity. These experts will be working with council leaders and community representatives to work out a recovery programme. (This is also mentioned in the article in the appendix).
Views of people local to Rotherham town centre show a general dissatisfaction with what the CBD has to offer. This is shown on the next page.
The task of regenerating business back into the centre is not just a Rotherham problem. In many respects, Rotherham is probably no different to many towns, trying to cope with changing shopping patterns, needs, and preferences, as more and more out of town shopping complexes (with a recent building being the White Rose shopping centre in Leeds), are built.