In our random sample we asked a range of people in a different range of places. This was because we thought it would be a fairer sample as we would get a range of different ages, wealth and gender. We mainly asked older people ranging from 30-70 but did ask some younger people as well. This was because we went on a working day and it was mostly pensioners that were shopping with just a few younger people. After the sample study we did not have to change our sample questionnaire.
Land Use Maps
A land use map is an outlined map with all the names of shops on it. We used this to see what ratio of shops there are in each type of shopping centre. We separated the shops into three categories, high order, middle order and low order. We completed the maps by sketching a rough outline of the surrounding area and labelled the shops. We colour coded them according to their order. This allowed us to compare the proportion of high, middle, and low order shops and services in the three centres.
Annotated Photos and Field Sketches
We chose to use this method to show how the shops were arranged, for example terraced, the amount of people around at the time and any particular features of the environment. We took photos or drew sketches in each of the places we visited. In Pangbourne we took photos of a Subaru Garage, the pubs garden and of the areas around Somerfields Store. In Tilehurst we drew sketches of the shops on either side of the road. We chose these locations because we thought they would show the types of shops and particular features of the environment that were around.
Any Other Techniques
I also used a number of other techniques. These include an environmental quality survey which is a scoring system that evaluates the cleanliness, quietness, how safe the area is, how spacious the area is and how attractive the area is. I stood in the busiest area so that it would be a fairer test. Points are added on for positive results and taken off for negative ones. I also used a pedestrian and vehicle count. For this I counted the number of vehicles and pedestrians that passed over a five minute period. I did it for five minutes so that I would get a fair enough sample. I stood by a road for each so it was fairer. I also looked at twenty different car tax discs to see where the cars originated from. This would help because it would show how far people have travelled to get to the shopping centre. However this data may be unreliable since the cars may have been bought outside of the local area and used by someone living in the locality.
These methods were chosen to further support our hypotheses.
Secondary Data
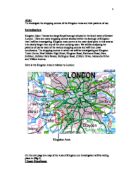
The secondary data we used was given to us by our teacher. We used an OS Map from the Landranger series, number 175, 1:50,000 scale (Reading and surrounding area). This was used to help with our land use maps and to understand where each place was in relation to each other.
Factors affecting the study
The study could be affected by a number of factors. Examples of which is the weather, since numbers of people may drop when the weather is bad, the time of year since there would be fewer outside visitors to the location and the time of day because many people may be at work or in school. These factors could affect the overall reliability of the results.