Aims
The main aim is to carry out:
An assessment of the factors which affect the catchment area and popularity of shopping centres.
This aim can be divided into several smaller questions:
- Do places with a greater variety of shops attract more people?
- Will people travel further to buy high order goods than they will to buy low order goods?
- What importance does:
* quality of shopping environment
*quality of shopping
*quality of car parking facilities
Have for attracting shoppers?
Method
On the day that we visited these centres, the weather was overcast, and had rained quite a bit already, very much a dull, cold day.
Interpretation and conclusions
Pedestrian counts: from fig 1 at the peel centre, you can see that the number of people at location 4 (outside the main shops) rose very high at the times of 11.15 – 12.15 and 13.00 – 14.00. This could be because that the time of 10.00 – 11.00 was too early for most people, or that this coincided with their trip to work. From fig 2 at Bracknell town centre, you can see that there were most people at 13.00 – 14.00, again later in the day as people might be out for the day. At 11.15 – 12.15 the number of people goes erratic. This could be cause by people having lunch. There were generally more people at Bracknell town centre.
Environmental audits: looking at my profiles for the peel centre, you can that generally the area wasn’t very good, having scored low for all of the factors in fig 3, 4 and 5. The score is much higher in fig 6 and 7, but facilities for litter is an all around low (except in fig 7, site 5). The scores for these profiles are all below, or on 4. The attractiveness was quiet good, with it being one of the highest scoring factors in each profile. The overall percentage score was 46.7%, which is much lower than that of Bracknell town centre, which scored an overall 65.5%. In the profiles for Bracknell town centre, the scores were mainly above or on 6, except for a few areas, fig 13, 15 and 16. These graphs all seem to have dipped because of lack of facilities for litter, or a large amount of litter seen around the area. This also brings down the attractiveness. Also, disabled access seems to be one of the lower scoring factors in most of the profiles. These scores show why there may have been more people at Bracknell town centre, with it being better overall and answers question 3 (quality of shopping environment) of my aims. My local area seemed to do quite well, with the factors mostly scoring 6 or 7, with its attractiveness being the lower scoring of 4. Its overall percent of 58.3% beat the peel centre’s 46.7%, although, if more audits had been taken, I think the overall percentage wouldn’t have been as high.
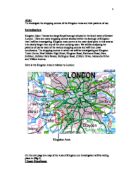
Land use mapping and pedestrian flow lines: looking at fig 19, the flow lines for the peel centre show that there are most people in the centre of Bracknell town centre, Charles square. This is a square lined with shops, and so has a high variety of small shops. That could have caused the high figure, or the fact that people pass through here to get to the other side of Bracknell town centre. Fig 20 shows that Bracknell town centre has a high variety of shops, which as Bracknell town centre attracted more people than the peel centre, answers question 1 of my aims. Looking at fig 21, you can see that there were more people around the shops than the entertainment facilities. This could be young people would have been in school, so families and children wouldn’t have gone to the facility. Moreover, people would have gone out of their way for the comparison goods the shops were selling, and so would have got those instead of going to the entertainment facility. Fig 21 also shows that there is less variety of shops than Bracknell, which answers question 1 in my aims. Fig 22 shows more people passed my local shop than there were at the entertainment facility at the peel centre. This is surprising, but it is a useful shop for the close-by residents, and so would attract them for everyday items, and the parade is also along a road which leads to the centre of Twyford with its waitrose and other small corner shops (convenience stores there were run out of business by waitrose). Fig 22 also shows that there are only 4 different shops along that parade. With the amount of pedestrians counted, this can also be related to question 1 in my aims.
Questionnaire graphs: Fig 23 – 32 = Bracknell town centre
Fig 33 – 42 = peel centre
Fig 43 – 52 = local area
Looking at fig 23, you can see that most people go there more than once a week and weekly (equal). Fig 33 shows than most people go occasionally, with the rest joint with weekly and more than once a week. This shows that more people go to Bracknell, which has a larger variety of shops. This answers question 1 of my aims. Fig 43 shows that most people go to Twyford convenience store more than once a week, as it’s local, so they can just walk. Looking at fig 24, this shows that most people went by car, while some walked and used the bus. Fig 34 (peel centre) show that all people came by motorized vehicle. This could show that people travelled further to go to the peel centre than Bracknell town centre as they used the car and bus, which could answer question 2 of my aims, as the peel centre is comprised of high order stores, which sell comparison goods. Fig 44 shows that most people walked as its local. Looking at fig 25, you can see that less people that visited Bracknell town centre lived outside Bracknell than people who visited the peel centre (fig 35). This again shows that people travelled farther to go to the peel centre, answering question 2 of my aims. Nearly everyone that visited my local area lived in Twyford, as it was a low order shop (fig 45). Looking at fig 26, you can see that most people that visited Bracknell town centre where there to buy convenience goods, while most people at the peel centre went to buy comparison goods (fig36). This again answers question 2 if you relate the graph with fig 35. Fig 46 for Twyford shows that everyone went to buy convenience goods, as that shop doesn’t sell comparison goods. Studying fig 27, most people visited Bracknell town centre as it was near to home, while not many people chose as it was close to work or there was more choice. Also, no people said that it was because it was a nice shopping area, which seems to contradict my audits. Fig 37 shows the same no. of people for the near to home/work as Bracknell town centre, which contradicts my recent answers to question 2 (recent answers of yes). Moreover, fig 37 shows that people chose the peel centre as it had more choice than Bracknell centre, which contradicts my building use maps, and that people answered that the peel centre was a nicer shopping area than Bracknell town centre. This could have been because people where flustered. Fig 47 shows that most people chose my local area as it was near to home, which is what you would expect with it being in a residential area.
Fig 28 shows that quality was most important, with price also important. Fig 38 shows that quality was also very important, although other was the preferred answer there. This seems to answer question 3 (quality of shopping) in my aims. Fig 48 at my local centre shows that price was most important, closely followed by quality. This may have been because there are some council estates nearby, with quite a few poorer families. Fig 30 for Bracknell town centre shows that most people who visited the Bracknell town centre were 30-60, with only 2 people over 60 and 1 under 20. The peel centre also shows in fig 40 that most people were over 60, while 3 were 30-60. This could be because it was a school day, but also because most people would be at work, with people who were retired free to come shopping. This was the same with my local centre, but with 2 people 20-30 and under 20 as the exceptions. This could be because they lived at home still or worked locally. Fig 31 for Bracknell town centre showed that an even number of people found Bracknell busy as was found quiet, with 2 people saying that they found Bracknell moderately busy. This contradicted the mostly moderately busy/ quiet answer given by people at the peel centre in fig 41. This shows that overall, most people found Bracknell moderately busy. I was told that this fluctuated over the weekends, with it being far busier as it’s a non school/work day for most. Fig 51 shows that people thought that Twyford was quiet, as it’s a small town of little shopping importance. This answers question 1 of my aims, as Bracknell, the area with the most shops and variety was busier than Twyford. Lastly, comparing fig 32 with fig 42 showed that people thought that the peel centre had better facilities than Bracknell town centre. This could be because of the entertainment facilities, restaurant, comparison goods sold or the ‘feel-good’ high you get from purchasing something expensive and ‘one-off’ like a couch, etc. This again seems to contradict my audit that I took, but that may have been because I was biased as stated in my method. As the peel centre has an extensive car parking facility with automatic tickets, gates, a lot of space, etc this could be one of the reasons that the peel centre was favoured over Bracknell town centre, and would therefore answer question 3 (quality of car parking facilities) of my aims. Fig 52 shows a higher score than that of the peel centre or Bracknell town centre. This was most probably to do with village pride, or the fact that it is/ the owners are well known and liked locals.
Photos and catchment area: my photos show the different factors that affect the state of sites located within the peel centre, Bracknell town centre and my local area. Fig 53 shows an area that wasn’t very good in my opinion. It demonstrates lack of some of the factors I was measuring in my audit, or not enough of others, such as lack of security, litter, etc. you can see that this area isn’t very visually appealing as well as not having necessary facilities and lights, bins, etc. fig 54 shows an area that really caught my attention for having a good supply of the necessary factors in my audits. It’s visually appealing, as well as having bins, benches, and a good disabled facility to help people reach the upper tier of the shops. It is a prime example of how a shopping area could look to be at its best. Fig 55 shows an area of the peel centre, and points out everything I’ve written about. It also shows all of the factors that I’ve got in my audits, and is generally a good area, especially pointing out the walkway with a roof. You can see also a small part of the extensive car park. Lastly, fig 56 shows my local site, the Twyford convenience store on its parade. This area is quaint and overall pretty good for its size and status. There is little litter and the upkeep is good, albeit that’s also because it’s much smaller than the other areas in Bracknell! Twyford convenience store also has good security, with a grille, lights, and extensive camera use within.
My catchment area map shows the different sizes of the catchment areas for all 3 of my different sites. It shows that the catchment area for my local site was the smallest, as expected with the points being quite nucleated compared to the other catchment areas. All but one person in it was from Twyford, the local area, except one person from Charvil which is an even smaller village right next to Twyford. The peel centre and Bracknell centre catchment areas are interesting in the way that they appear to be the opposite of what they should be. The peel centre, which sells high order goods, has a smaller catchment area than that of Bracknell town centre, which has a huge catchment area. This contradicts my answer to question 2 of my aims earlier in the interpretation, as I found evidence that people would travel further to buy high order goods. This hard evidence completely contradicts that, and is the better evidence as it can be directly linked to that question. However, I think that there were some factors that affected these results, being that 1 person said that they were from Spain, and from his other answers in my questionnaire, seemed to be lying for humour. We also questioned a person from Uxbridge, who was on holiday, and so was not a prime person to include in this questionnaire. Nevertheless, this is data that is valid, and so it must be said that from looking at this, the answer to question 2 in my aims would have to be no.
Conclusion summary:
Do places with a greater variety of shops attract more people?
From my interpretation of my data, the answer to this question would have to be yes. Looking through the data and patterns I have described in my interpretation, you can see that I have linked patterns I’ve found to this question, in turn answering it a number of times. For example, I have linked the fact that Bracknell has a larger variety of shops than the peel centre (land use mapping), and the fact that Bracknell had a higher pedestrian count than the peel centre (flow lines, pedestrian count graphs) to answer question one of my aims. However, in fig 27 and 37, people have said that the peel centre has more variety than Bracknell town centre. This could be because the peel centre sells a lot of comparison goods, with many stores selling the same merchandise in different styles (couch in different forms). My answer to thins question is still yes though, since my ‘for’ evidence greatly out numbers my ‘against’ evidence.
Will people travel farther to buy high order goods than they will to buy low order goods?
From my interpretation of my data, I have found different answers to this question, coming from different aspects of my collected data. Looking at figures 24 and 34, fig 34 shows that most people all people either used a bus or the car to get to the peel centre, while fig 24 for Bracknell town centre shows that some people walked. This would answer question 2 in my aims with a yes, as if a distance is far, you’d go by car. But if a distance isn’t that great, you’d walk, showing that people generally travelled further to get to the peel centre. Fig 25 showed that more people who visited Bracknell town centre lived in Bracknell than the peel centre (fig 35). This again answers yes to question 2 in my aims; as people went further to go to the peel centre, than people went to go to Bracknell town centre. Comparing graphs 26 and 36 showed that a lot more people went to the peel centre for comparison goods then went to Bracknell town centre, showing that the people that came by car and bus mostly came for the comparison goods. However, fig 37 and 27 show that the peel centre and Bracknell town centre were chosen to go to by exactly the same number of people for the reason that it was close to home/work. This shows that people didn’t travel farther to get to the peel centre than Bracknell town centre, as people wouldn’t have put for a reason to go it was ‘close to home’. Lastly, my catchment area shows that people travelled less far to get to the peel centre than they did to get to Bracknell town centre. This answer is as I have stated under the appropriate heading ‘better evidence as it can be directly linked to that question’ (question 2). Looking through all of this evidence, I would have to say in the end that the answer to question 2 is that people would not travel further to buy high order goods than to buy low order goods, or a no to question 2.
What importance does: *Quality of shopping environment
* Quality of shopping
* Quality of car parking facilities Have for attracting shoppers?
*Looking through my environmental audits, I have marked Bracknell town centre with a higher number of points than the peel centre. This means that Bracknell town centre has better shopping facilities than the peel centre, scoring an extra 18.8 % of the possible total marks than the peel centre, with 65.5 of the possible total marks on facilities. Looking at my photographs, you can truly see the differences in quality of shopping environment. Fig 54 shows the huge amount of good factors that make the facilities of Bracknell town centre brilliant, although fig 53 portrays a bad area of Bracknell town centre, it was a small area of the town centre, the worst I could find! Fig 55 shows the facilities of the peel centre are good quality, but not as good as those of Bracknell town centre, while fig 56 is the same, showing my local area. Seeing as Bracknell had the higher number of pedestrians than the peel centre or my local area, and looking at my audits in comparison with the pedestrian counts, I think it’s safe to say that quality of the shopping environment plays a big part in attract ting shoppers. However, fig 27 shows that no one chose Bracknell town centre to shop in for its nice shopping area, which contradicts my audits. Also people answered that the peel centre was a nicer shopping area than Bracknell town centre in fig 37 (the same graph as fig 27 but for the peel centre). This contradicts my answer to this question. This may have been because the peel centre was less crowded and other things that I have listed (paragraph above photos and catchment area). I still standby my answer to this question though, because although people mainly come for the shopping, the facilities make a difference to whether they can do this comfortably and with ease, or not.
*looking at fig 28 for Bracknell town centre, you can see that quality of shopping was the most important ‘choice of shops’ influencing factor. Also, in fig 38 for the peel centre, you can see that quality was also an important factor, although other was the preferred answer here, which probably was because the shoppers were flustered. Looking at my land use maps, you can see that Bracknell town centre has a higher variety of shops than the peel centre, which would also improve the quality of shopping, which could be why there were more people at Bracknell town centre. Looking at the catchment area, you can see that Bracknell town centre had a larger sphere of influence than the peel centre, which could have been due to the variety of shopping and therefore better quality of shopping. On the other hand, looking at fig 37 and 27, you can see that people thought that the peel centre had more choice than Bracknell town centre. This may be the case in what the superstores specialise in, but Bracknell town centre definitely has more variety. Looking at this information, the answer to this question would have to be that the quality of shopping is very important for attracting shoppers, as that’s what the shoppers’ main purpose of going there is, to shop.
*looking at fig 42 and 32, you can see that people though that the peel centre had better facilities than Bracknell town centre. One of the main reasons that this happened I think was to do with the extensive parking facilities that the peel centre has. This car park is huge, located just next to the shops and is easy to find and get into. It has automatic tickets, gates, a lot of space, and lights for late night shoppers and is covered by cameras as well. People could even park here and walk to Bracknell town centre, as it’s much easier to do. The automatic tickets you get also ensure that you pay for the amount of time you’ve used, instead of you buying to much/little time on older tickets. Also, you get to park for up to 2 hours for free.
Looking at this, I would have to say that the quality of car parking facilities is quite important for attracting shoppers, otherwise shoppers with cars would be turned away if they couldn’t park, or had to park really far away.
An assessment of the factors which affect the catchment area and popularity of shopping centres.
Looking through my answers to the several questions that make up this big question, and the data and evidence that I have gained from my raw data, and it’s interpretation into graphs, diagrams and explanatory writing, I would have to say that I’ve answered the questions that I set out to answer, that I have completed my aims in this assessment of a range of different factors. I’ve explained each individual piece of data in every section in detail, including the reason for the certain methods that gave me the data, the resulting evidence gained from the data and the graphs, diagrams and tables that were created from the assortment of data. I have carried out what I set to do, and I believe that I have done it well, giving me the eventual evidence I needed to support my claims, which are as follows: places with a greater variety of shops attract more people, people won’t necessarily travel any further to buy high order goods than they will to buy low order goods and the importance that: quality of shopping environment, quality of shopping and quality of car parking facilities have is high. All in all, I think that I have successfully answered the main question of my aims, to a high degree of accuracy.
Overall evaluation
Reliability of methods.
Questionnaires: this method was easy to do, and it measured a range of factors linked with our main aim. We randomly selected 10 people in Bracknell town centre, and the peel centre and our local area and asked them 10 questions. This gave us a good range of data to work with. A few problems with our method were that some people didn’t want to be asked, and the age range was limited.
Land use maps: this method was good, because it gave us an exact record of the shops at the certain areas we visited. Though there were problems, as people found that shops fell under different headings (i.e. bank, general store). Although it took some time to do, this method was reliable and relatively easy
Pedestrian counts: this method was very easy to do, and so meant that we were less likely to make a mistake. It was a sound method, standing at a spot and counting passing pedestrians for 5 minutes. This was done at 5 different sites around the peel centre and Bracknell town centre, and 1 site at my local area. We repeated this 3 times through the day.
Environmental audits: for this, we selected a range of different factors to measure, amounting to 6. We then looked around 10 areas for Bracknell town centre, 5 for the peel centre and 1 for my local area, and marked the facilities using a score system of 1-10 for each factor. A problem with this method is that we may have missed things in the area we were grading.
Photos/sketches: we photographed audited areas and annotated them to show different factors that were in my audits, also including areas where those were missing. This was easy to do, and quick too. The photos showed how factors affected an area to make it better, and how a lack of them made an area less attractive.
Accuracy of results.
Questionnaires: these results couldn’t have been inaccurate, as they were copied directly from the related person’s mouth, unless they lied. This might have happened in one case as I’ve looked into (catchment area- interpretation). However, the time of day/week might have affected the assortment of people we questioned, which could be fixed by repeating this on different days and times for reliability. I think though that my results from these were reliable enough to complete my objectives.
Land use maps: these results mainly reliable, but with the problem I stated under ‘reliability of methods’. Also though, the map was out of date, and some buildings didn’t fit the categories, so some new building codes had to be added. A marked improvement here would be to have a new, updated base map. Also, one person could work out what heading each shop fell under, so we could all have the same completed base map! I think that my results are good though, with me correcting the map, and looking through others maps to find out differences in shops.
Pedestrian counts: these, again are mainly reliable, but with the problem of some of the areas being ‘to busy’. This meant that there were a lot of people to count, and so some may have been missed, or counted twice as the counter worked in haste. To solve this, more people could be counting, and a clicker could be used. These results are reliable though, as there were big differences in the counts, so 1 person wouldn’t have had a huge impact on accuracy.
Environmental audits: my environmental audits are quite reliable, I think, although they seemed to go against what my questionnaire graphs showed in fig 32 and 42, as I said that Bracknell town centre had better facilities, but the public thought that the peel centre had better facilities. This showed that the audits were biased, which could be corrected by my whole group carrying out the audit together. I have to say though that I think these results weren’t the most reliable I have.
Photos/sketches: my photographs are very reliable, as they are pictures of the actual shopping centres, and then I just pointed out the factors that coincided with my audits. However, I couldn’t record everywhere, meaning that the photographs may be biased as they may show better areas. To correct this I could have taken a photograph of the best and worst scoring sites of my audits, and shown why they got such a low mark.
Validity of conclusions
Questionnaires: overall, I think my conclusions are valid, as they include a random selection of 10 people for each site, good range. These results gave me invaluable information when answering my aims, and could only have been improved only to give a fairer range.
Land use maps: overall, I think that this has been very useful in helping me with the variety of shops in the centres. This information was reliable and practical in directly answering one of my, and partially others. I believe that my conclusions here are valid, as well as being an excellent source to help my other conclusions.
Pedestrian counts: these were also just as good as the land use maps in helping me to answer my aims, as most concentrated on factors that attracted shoppers, making this ideal to show the differences in shoppers attracted to certain areas. For this, again I think that my conclusions are solid and suitable, definitely valid.
Environmental audits: