The amount of vegetation will decrease the levels of interception in the soil. This is because the plants and grass is intercepting the water and delaying or stopping the water being infiltrated into the soil. Interception refers to that does not reach the soil, but is instead intercepted by the vegetation and plants. If the area had no vegetation then the infiltration rates will increase, unlike if the land was full of vegetation because less will be collected due to interception.
Antecedent conditions will affect the infiltration rates depending on the weather before we took are experiment. If it had been a hot day and the soil was had baked then the water absorbed would be a lot less and possibly create surface run off. But also the water absorb may even increase as the soil is dry and needing water. If it had been raining then and the land was saturated then no more water could be absorbed into the soil. If it had been a dry day and there was no rainfall then this would be a good weather condition and the level of infiltration will be steady and possibly conclude in a good collection of results.
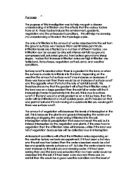
The experiment grounds.
This image is an overlooking view of are experiment, the circled grounds is where we took are results and tested the infiltration rates. The arrows pointing to each site is the different area’s, which where sampled grounds.
We chose this area as it provided me with the suitable grounds for my experiment. It also had the variable land sources, for vegetation cover, gradients, no vegetation and tree cover. It was also still in the school grounds which meant we has easy access towards the site.
Key
Site 1- 0º slope, under tree, no vegetation
Site 2- 5 º slope under tree, no vegetation
Site 3- 13º slope, 100% grass cover
Site 4- 0 º slope, 100% grass cover
Site 5- 0 º slope, 58% grass cover
Site 6- 10.5% slope, 65% grass cover.
Key questions
• Does the infiltration rates get affected if there was more vegetation cover?
• Does the gradient affect infiltration rates?
• Does the antecedent conditions effect infiltration rates?
Data Analysis and explanation
We found that the relationship of the infiltration rate and the gradient showed no correlation and was almost unchanged; this is shown in fig 1. The R²=0.0018 which means there is little correlation towards the data and correlation. The graph shows me that as the gradient increased the level of infiltration stayed the same, therefore this didn’t matched with my hypotheses. All the points on the graph where scattered some were also anomalies showing me there is no significant results telling me the relationship was negative. Our experiment was contained in a plastic pipe which would of stopped surface run-off and would on concentrated on one particular point in the soil. This therefore meant are results were fixed and not an accurate experiment.
In my hypotheses I correctly predicted in fig 2 that vegetation will affect the infiltration rate. If there was more vegetation then the process of infiltration will be delayed by interception, which captures precipitation and delays the amount of rainfall reaching the surface. Although from fig 2 my graph shows that the rate of infiltration didn’t decrease as much as we expected, because some of the graph points were very scattered as anomalies. Therefore there was no strong correlation with the line of best fit. Not completely proving my hypothesis.
The graph above is called the ‘significance of the spearman’s rank correlation coefficients and degrees of freedom’ technique this will statistically show if my data shows any significant results. I need to know if the relationship between gradients, infiltration and vegetation are significant and occurred by chance. The graph above tells me that 0.2 at 4 gradient- is to low of significance as it’s lower than 5% therefore it is only 95% reliable. To have a more accurate number of results we could have done more experiments. This would eventually come to a pattern and become clearer. This will then show me a more accurate set of results, with a clear pattern and correlation.
In fig 3 the averages of soil were 2.4cm/m, grass was 1.59cm/m, soil and grass was 0.62. This will then show me that the level of infiltration was best with soil showing me that my hypothesis was correct proving my points that interception most affected the infiltration rates. Interception would delay and stop the amount of infiltration into the soil. If the soil was clear this would then therefore allow it to infiltrate without any obstacles or elements.
Aimee Andrews