Methodology
Questionnaires
Method
I went out onto the streets of Faversham on Thursday 1st July with a clipboard and kindly asked the public the following questions in three different places around the town:
1) What town, village or district do you live in?
2) How do you usually travel here?
3) What is the main reason that makes you come here to shop?
I recorded my answers onto the questionnaires and then asked some more people.
Data Use
The data I collect from the questionnaires will be put into desire lines to show where pedestrians have come from.
Where and When
I will ask the questionnaires in five different places around Faversham town centre as shown below. I will fill in the questionnaires on the 1st of July 2004.
Advantages
I collected the data myself and asked people rather than just getting information of the internet or from another source.
Disadvantages
I only recorded the data on one day.
Improvements
To improve the results of my questionnaires I could have done them on a Saturday when more people go into town to shop. I know this as I live in Faversham.
Methodology
Tax Discs
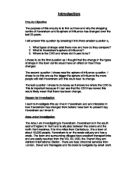
Method
I went to the car park by the Faversham swimming pools on Thursday 1st July and Friday 3rd September with a clipboard and noted down where peoples tax discs had been stamped so that I knew where they were from.
Data Use
The data I collect from the tax discs will be put into desire lines. The desire lines will show me where people have travelled from to get to Faversham and therefore showing the sphere of influence.
Where and When
I will take down the tax discs on Thursday 1st July and Friday 3rd September at the car park by Faversham swimming pools.
Advantages
I have taken the tax discs down on two occasions so I should have more varied and better results than of I only took them down on one day.
Disadvantages
Some people might not get their tax disc stamped at their local post office so I will have a false indication of where they are from.
Improvements
To improve the results of my tax discs I could have done them on a Saturday when more people go into town to shop. I could also have got some tax discs from another car park such as Institute Road car park.
Methodology
Pedestrian Count
Method
I went to Faversham town centre with a clipboard and found 5 places to do pedestrian counts. I sat against a wall at my different spots and counted how many people walked past me within 5 minutes
Data Use
The data I collect from the pedestrian counts will be used in proportional circles. These circles will show me where there are the most people in the CBD.
Where and When
I will take down the pedestrian counts on Thursday 1st July at different points around Faversham town centre as shown below on the map.
Advantages
The pedestrian counts will show me where the CBD is.
Disadvantages
More people go shopping at the weekend so I might have had better results.
Improvements
To improve the results of my pedestrian counts I could have done them on a Saturday when more people go into town to shop. I could also have taken pedestrian counts at a different time.
Methodology
Land use Mapping
Method
I went to Faversham town centre and noted down what the different land uses are around the CBD.
Data Use
The data I collect from the land use mapping will be used in land use maps. These will be made by getting goad maps and colouring in the different uses on them
Where and When
I will do the Land use mapping on Thursday 1st July in and around Faversham town centre.
Methodology
Mapping of Height of Buildings
Method
I went to Faversham town centre and noted down the height of the buildings and the width of the shop fronts in the town.
Data Use
The data I collect from the height mapping will be used in scatter graphs. I will plot height of building and width of shop front against distance from the CBD.
Where and When
I will do the height mapping on Thursday 1st July for most of the shops around Faversham town centre.
Methodology
Environmental Survey
Method
I went to Faversham town centre and noted down 6 things on a scale of one to ten for each place, the attractiveness, how quiet it was, how interesting it was, how safe it was, how well the buildings were kept and how much litter there was.
Data Use
The environmental survey scores will be put into radar graphs.
Where and When
I will take down the environmental survey scores on Thursday 1st July at different points around Faversham town centre as shown below on the map.
Methodology
Annotated Photos
Method
I went to Faversham town centre and took photos of different shops and places around the town
Data Use
The photos I take will be used to show evidence and back up my questions.
Where and When
I will take the photographs on Thursday 1st July around Faversham town centre.
Mini Questions
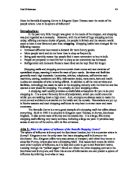
Question 1:
What types of shops exist there now, used to be there and how do they compare?
My land use maps show me what types of shops different shops are, high order, low order or services. Figure 3a shows a land use map of 2001 and figure 3b shows a land use map of 1975. I can see that there was a lot more services than there are now and that there is a greater variation in the types of shop now than there was in 1975. This greater variation could mean that the sphere of influence is bigger. A main difference we can see between the two maps is the amount of types of shops such as butchers, bakers, chemists and greengrocers. In 1975 there were three chemists, three greengrocers, seven butchers and three bakeries. In 2001 there was one chemists, 3 butchers, two bakers and no greengrocers. This is because since big supermarkets like Tesco have been introduced into Faversham there is no longer a need for more specialised shops as everything you need is under one roof. In 1975 there were only 4 vacant shops but in 2001 there were 13 vacant shops. I can see that some shops that were there in 1975 still exist now but have moved premises. This may be because the CBD has moved and they wish to be there for optimum trade.
Question 2:
What is Faversham’s Sphere of Influence?
My desire lines show me where people have travelled from to get to Faversham and how many people have come from each place. Figure 1a shows desire lines I have drawn from information I have collected from tax discs. Figure 1b shows desire lines I have drawn from information I have collected from questionnaires. I can see from figure 1 that most people in the town and most of the cars in the car park were from Faversham. I can also see that the further you travel away from Faversham the less people there are that come from that place, fore example on figure 1a twenty of the cars were from Faversham and only five were from Ashford and even further away there is only one car from Dartford. The size of the town or city also depends on the amount of people going into Faversham. On figure 1b I can see that even though Canterbury is further away than Boughton there were more people from Canterbury as it is larger than Boughton. From looking at figure 1a and 1b together I can see that the cars come from further than the pedestrians. This information could help me in interpreting my scatter graph. In figure 2 a scatter graph made with answers from questionnaires I can once again see that the further away from Faversham you get the less people are from these places, this agrees with my desire lines. On my scatter graph I can see that most people are from Faversham showing me that most of the people in the questionnaire were pedestrians. On an old goad map I have used it shows evidence that there was access for public transport through the town centre. There are bus stops a bus office and arrows showing the flow of the buses. There are no longer buses that travel through the town centre and this could affect the amount of people wishing to come into Faversham.
Question 3:
Where is the CBD and where did it use to be?
The CBD in Faversham is in the area where Market street, East street and Preston street meet up as shown on figure (----------------). I came to this conclusion using my proportional circles, figure (----------------) showing me the amount of people in an area. From these I could see that there were most people in location 2 and so the CBD is most likely to be there. Around that area there is also more high order shops then there are in other areas. I do not think that that is where used to be though. I believe that the CBD used to be in location 1. As you can see in the photographs, figure (-------------------------), the shops are high and have small shop fronts. This shows that the CBD was there because the cost of the land to build on would have been more expensive so the buildings would be smaller and taller. As we get further away form the CBD the shops have less storeys and bigger shop fronts. We can also where the CBD is because the environment is usually cleaner more attractive and the buildings are well kept. Looking at my radar graph I can see that where I think the CBD is it is clean and attractive but the buildings are not very well kept. This does not agree with what I have said above. I mentioned that the CBD has changed over the years but I also think that the CBD changes slightly during the week also. This is because Faversham holds a market on Tuesdays at location 1. I think that on the market days the CBD moves to location 1 and then moves back for the rest of the week.
Conclusion
Key Findings
These are the main things I have found out from answering my mini questions:
- There are not as many smaller specialised shops, such as butchers, than there used to be.
- There is greater variation in the types of shop than there used to be.
- The main sphere of influence is a rough 10 mile radius with only few people coming from places further a field.
- The CBD has moved over the last 25 years
- The CBD moves slightly during the week
The shopping centre of Faversham has changed over the last 25 years in numerous ways and for numerous reasons. The main ways that it has changed is that the CBD has moved and the types of shops in the town centre have changed. The main reason it has changed is because of its sphere of influence and the change in the types of shops. It may seem nonsensical that the change in the type of shops is caused by the change in the types of shops but it does work out. If for instance a greengrocers changed into a clothes shop then people who wished to buy clothes would visit the town centre more. Other shops would see that trend and turn into clothes shops also, catering for the consumers need in a sort of domino effect. I did not have any information to tell me what Faversham’s sphere of influence was like in 1975 so I have had to draw my own conclusions from information I have got of the shops and geographical theory that I know. This theory is quite basic, the more comparison shops there are the greater the sphere of influence. In Faversham since 1975 there has been a decrease in convenience shops and an increase in high order or comparison shops so I can say that the sphere of influence is greater now than it was in 1975. The shopping centre has also changed because the CBD has moved. The CBD has moved because the larger high order shops want more room to move into so they buy the larger shops out of the CBD which then moves the CBD to where they are.
Evaluation
Method
When collecting my data I did not encounter too many problems and if I did then the problems were not huge. The main problems were with the amount of things I were recording or the time at which I recorded them. With all my data I think it would have been a good idea to repeat them rather than to just get one set of results. This would mainly help my questionnaire data, pedestrian counts and tax discs. To get fairer results to for my environmental quality survey I could have asked some friends or members of the public to complete a survey or a pedestrian count for me so that I could take an average of the findings and get fairer results. The time when I did all of these methods would also improve my results.
Results
Overall my results were very good although they could have been tweaked in a few places to improve them. The problems in my method such as collecting the data at one time only would have an effect on my results. Because I asked all my questionnaires on a Thursday during school hours I did not speak to many young people. My results may therefore be inaccurate. Because I also took my pedestrian counts on the same Thursday I did not get a fair recording of the amount of people. The place where I got the most people in my pedestrian count may have had a lot of shops directed at adults so they would be in that area of town. If I took the count on a Saturday then I might find that all the young people shop where I got less people for my count.
Conclusion
Any inaccurate results I have got will make my conclusion untrue because I will not have the true story of what is happening in the town. If I have interpreted any data wrongly then I will not be able to answer my main question correctly. I feel that my conclusion is quite good as I have used good techniques to help me answer all the questions. I realise now that I could have also asked the question ‘How has transport to the town changed?’ to help me in my investigation.
Overall if I had to go back and do this whole project again then I would take all questionnaires, counts etc more than once and on different days of the week, one preferably on a weekend. I would also used a few more techniques to get a wider understanding about the shopping centre in Faversham