Hypothesis
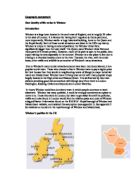
In Windsor:
- Quality of life is greater in suburbia than it is in the CBD (central business district), because there is less traffic and a better environment, i.e. better schools and parks in suburbia than in the CBD. The quality of houses is also higher in suburbia, the houses are larger and better equipped and have bigger gardens, and they often have more off road parking.
- Quality of life is greater in residential areas away from main roads than it is on main roads, as noise and air pollution is high near main roads whereas residential areas away from main roads have peace and quiet.
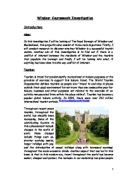
Method
In this investigation we have been working in-groups of two or three and have collected necessary data along a given route or “transect” in Windsor. There are twelve transects all together in this investigation, each one is approximately 2 km long. Each group has collected data on four transects, two in west Windsor and two in east Windsor. Transects radiate from the CBD. Data was recorded, on the two sheets provided, at 200 metre intervals- ten collecting points for each transect. Data was recorded starting from sample point 1, nearest to the CBD, and ending at sample point 10, farthest from the CBD. Data recording sheets were required for this task, which was completed in one school day. In the morning, from 9 a.m. to 12 a.m., we worked out in Windsor, before returning to school so that all the results could be pooled together in a table. In the afternoon, from 1 p.m. to 3.30 p.m., we finished recording any unfinished results in Windsor. The main data-recording sheet is explained:
Transect routes
Route descriptions
Written from points 1 to 10, going away from the CBD.
TRANSECT ONE
Swimming pool, Clewer Park, Maidenhead Road (south side), Aston Mead to Gallys Road.
TRANSECT TWO
Vale Road (at Buckland Cresent), Hanover Way, Tudor Way, Longmead, Testwood Road (to Ruddlesway)
TRANSECT THREE
Parsonage Lane (at Haslemere Road), Dedworth Road (north side), Gallys Road, end of Butlers Close.
TRANSECT FOUR
Dedworth road (south side) at St Andrews Avenue, Kentons Lane, Foster Avenue, Wolf Lane, Duncannon Cresent.
TRANSECT FIVE
North side Clarence Road, Hatch Lane to Perrycroft.
TRANSECT SIX
Imperial road (junction with Springfield Road) East Side, Winkfield Road, St Leonard’s Road, and St Leonard’s Hill.
TRANSECT SEVEN
High Street (station), River Street, Goswell Road, Arthur Road (north side), Parsonage Lane, end of Chantry Close.
TRANSECT EIGHT
Top of Peascod Street, Clarence Road, Clarence Cresent, Bexley Street, Albert Street, Imperial Road, Green Lane (west0
TRANSECT NINE
High street (Queen Victoria’s statue), Sheet Street (East Side), Kings Road (west side) to Queen Anne’s Road.
TRANSECT TEN
Peascod Street (Queen Victoria’s statue), William Street, Alexandra Road, Bolton Avenue, Bolton Cresent, Wood Close.
TRANSECT ELEVEN
Charles Street (north end, Ward Royal side), Trinity Palace, St Leonards Road to Spital.
TRANSECT TWELVE
Clarence Road (from Trinity Palace), Vansittart Road (underpass), York Avenue, Bulkely Avenue, St Leonard’s Road to junction with peel Close.
Analysis of results
I will be concentrating on transects 1, 3 and 4, outside the CBD and transects 10, 11 and 12 inside the CBD. My analysis supports both hypotheses made at the start of this investigation. This will help me to draw my conclusions later on.
Hypothesis1
My first hypothesis was:
Quality of life is greater in suburbia than it is in the CBD.
Transects1, 3, 4(outside the CBD), 10, 11 and 12 (inside the CBD) support this hypothesis.
Transect 1 stretches from sample point 1, at Windsor Leisure Centre and goes through Clewer Park, Maidenhead Road (south side) and Aston Mead. It ends at sample point 10 at Gallys Rd. It radiates away from the CBD in this order (sample point 1 is always nearest to the CBD for every transect). The results from transect 1 show an increase in quality of life, from 61 to 87 quality of life points. However, the results fluctuate at sample points 2,6 and 10- they go down rather than up at these sample points. Sample point 2 is the first fluctuation, this may be because there is a large roundabout forming a junction for the A332, coming from Slough, with Maidenhead road. This roundabout causes there to be more litter, less street furniture, no parking, more traffic and less safety and therefore 3 less quality of life points have been awarded to sample point 2. I would expect there to also be more nuisance and air pollution at the roundabout, but this is not the case. Sample point 6 is the second fluctuation, this may be because the local authority has invested less money. As an outcome of this sample point 6 has lower quality roads, more telephone and electricity cables and less traffic safety and therefore 4 less quality of life points have been awarded to sample point 6. Sample point 10 is the third fluctuation. This may be because there is a row of shops nearby. Therefore there is more litter and more advertisements and 4 less quality of life points have been awarded to sample point 10. Nevertheless due to there being 7 of the 10 results in the predicted direction (in transect 1), this evidence proves hypothesis 1 is true for areas outside the CBD. The above relationships are shown in graph 1and in the proportional bar graph.
Transect 10 stretches from sample point 1, at Peascod Street (Queen Victoria’s Statue) and goes through William Street, Alexandra Road, Bolton Avenue and Bolton Cresent. It ends at sample point 10, at Wood Close. The results from transect 10 also show an increase in quality of life. However, the results fluctuate at sample points 3, 5, 7 and 10. Sample point 3 is the first fluctuation, this may be because of the Barracks taking away street life and limiting street beauty meaning there need not be any street furniture on sample point 3 as no one would want to sit there. Therefore 11 less quality of life points have been awarded to sample point 3. Sample points 5 and 7 are small fluctuations, they go down by only 2 quality of life points, and are difficult to explain. Sample point 10 is the fourth fluctuation, this may be because it is a side street with little street life and beauty and therefore sample point 10 loses out on 5 quality of life points for street furniture. Anyhow, due to there being 6 of the 10 results in the predicted direction (in transect 10), this evidence suggests that hypothesis 1 may be true for areas inside the CBD. But because there are 4 anomalous results, the evidence for hypothesis 1 being true in areas inside the CBD is weaker than the evidence for hypothesis 1 being true for areas outside the CBD. The above relationships are shown in graph 2 and in the proportional bar graph.
Both transect 4 and 12 are found away from main roads. Transect 4 is outside the CBD whereas transect 12 is inside the CBD. Transect 4 has a quality of life (average of 79.6 quality of life points) which is markedly higher than the quality of life of transect 12 (average of 69.5 quality of life points). Transect 4 scores 10.1 more quality of life points than transect 12, on average. In addition to this, transect 4 has a higher quality of life in 8 out of the 10 sample points. This proves that hypothesis 1(quality of life is greater in suburbia than in the CBD) is true for areas away from main roads. The above relationships are shown in graph 3.
Both transect 3 and 11 run along main roads; transect 3 runs along Dedworth Road, and transect 11 runs along St Leonard’s Road. Transect 3 is outside the CBD whereas transect 11 is inside the CBD. Transect 3 has a quality of life (average of 69.6 quality of life points) which is higher than transect 11 (average of 61.7 quality of life points). Transect 3 scores 7.9 more quality of life points than transect 11, on average. This suggests that hypothesis 1 may also be true for main roads. But because there is a small difference of only 7.9 sample points between transects 3 and 11, the evidence for hypothesis 1 being true for areas on the main road is relatively weak. The above relationships are shown in graph 4.
Hypothesis 2
My second hypothesis was:
Quality of life is greater in residential areas away from main roads than it is on main roads.
The transect pairs 3 and 4 (outside of the CBD) and 11 and 12 (inside the CBD) support this hypothesis.
Both transect 3 and transect 4 are situated outside the CBD. Transect 3 runs primarily along Dedworth Road. This is a main road and therefore transect 3 generally has a lower quality of life than transect 4 which runs through residential areas away from main roads. Transect 3 has an average total of 69.6 quality of life points, whereas transect 4 has an average total of 79.6 quality of life points. This difference of 10 quality of life points proves hypothesis 2 is true for areas outside of the CBD.
Certain factors of quality of life, in transects 3 and 4 change as would be expected. I would expect there to be less quality of life points awarded for litter, air pollution, nuisance, landscape/vegetation, traffic parking and traffic safety on transect 3 than on transect 4. This is because transect 3 runs primarily along a main road (Dedworth Road). Table 1 demonstrates this.
Table 1: Transect 3 (main road) has a lower quality of life than transect 4 (away from main road)
Both transect 11 and transect 12 are in the CBD. Transect 11 runs primarily along St Leonard’s Road. This is a main road and therefore transect 11 generally has a lower quality of life than transect 12 which runs through residential areas away from main roads. Transect 11 has a total of 61.7 quality of life points, whereas transect 12 has an average total of 69.5 quality of life points. This difference of 7.8 quality of life points suggests hypothesis 2 may be true for areas outside the CBD.
Certain factors of quality of life, in transects 11 and 12 change as would be expected. I would expect there to be less quality of life points awarded for air pollution, nuisance, traffic parking and traffic safety on transect 11 than on transect 12. This is because transect 11 runs primarily along a main road (St Leonard’s Road). I would also expect there to be less quality of life points awarded for litter on transect 11as a large population use main roads and will therefore drop litter around main roads especially if they are near the town centre or CBD as St Leonard’s Road is. This is not the case. A possible explanation for this could be that transect 11 ends in a quiet side street in which fewer people live. Table 2 demonstrates this:
Table 2: Transect 11 (main road) has a lower quality of life than transect 12
Conclusion
The purpose of this investigation was to find quality of life patterns in Windsor. My hypotheses, made at the start of this investigation, were:
- Quality of life near the CBD is poorer than in the suburbs
- Quality of life in residential areas away from main roads is greater than quality of life on main roads.
My hypotheses were proved correct on the whole. I have concluded that there is an overall trend in that the quality of life increases as you go away from the CBD, Central Business District, this was found both in residential areas away from main roads and on the main roads themselves. I have also found out that quality of life is greater in residential areas away from main roads than it is on main roads and have identified certain factors within quality of life that most cause this trend. The factors largely responsible for this were litter, air pollution, nuisance, traffic parking, and traffic safety, areas on main roads scored less quality of life points in these domains. To fully prove these ideas further investigation is required.
Evaluation
This investigation can be improved by:
- Covering a wider range of domains, for example we could have covered housing density, housing privacy, garden size and garden quality.
- Covering a wider range of areas and identifying which areas have advantages and disadvantages in certain domains. For example an out of town suburb might have less nuisance and less air pollution, but it would also have less of the buzz you get in the CBD of a busy town like Windsor.
- Carefully observing quality of life and making sure every area has had accurate marking. In this way we would obtain more reliable results.
- Investigating the standard of living as well as the quality of life.
- Giving questionnaires to the public about quality of life
Bibliography
For this investigation I used the text books:
- ‘The New Wider World’ by David Waugh
- ‘Heinemann Geography- People And Place’ by Gary Chambers and Stuart Currie
I also found information and maps on the Internet using:
- The Royal Borough Of Windsor And Maidenhead site
- Up My Street site (for maps)
My geography teacher Mr Bainbridge was also very helpful
.
Appendix
- People that go to work from Windsor
By car- 45,161 By Public Transport- 5,732
- Tourism in the RBWM (Royal Borough of Windsor and Maidenhead) is worth £360,000,000 per year (10% of the Borough’s GDP-Gross Domestic Product).
Tourism in the RBWM employs roughly 11,000 people
Approximately 1,000,000 people visit an attraction in Windsor every year
200,000 attend Ascot racecourse every year
`