Investigating whether there is a relationship between size of settlement and its functional index and sphere of influence.
Investigating whether there is a relationship between size of settlement and its functional index and sphere of influence.
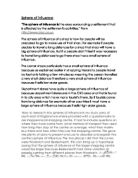
Aim and hypotheses:
My aim is to test the following relationships:
-The larger the population of a settlement, the higher the functional index will be.
-The greater the functional index, the larger the sphere of influence will be.
-People travel further for higher order goods and services, and do not travel as far for lower order goods and services.
Hypothesis:
I predict that if a settlement has a higher population, the functional index of that settlement will be higher. I think this because the Central Place Theory states that if a settlement is larger, it can support a higher level of services.
Taking this into account, I have made a second prediction, which is that the higher the functional index, the larger the sphere of influence will be. This is because I think that people will travel further for higher order goods and services. A place with a high functional index (for example Reading), selling middle and high order goods such as clothing, jewellery and electronics will attract more people than a settlement selling middle and low order goods such as food.
I also predict that the higher the population of a settlement, the larger the sphere of influence will be. Once again, taking into account that the Central Place Theory states that the larger the population of a settlement, the higher level of services it can support and the larger the sphere of influence will be. I think that this is because a settlement with a higher population is able to support higher order services, which people travel further for, thus creating a larger sphere of influence.
I think that Reading and Newbury will have the largest spheres of influence and the highest functional indexes, as they both have large populations, which are able to support higher order goods and services. Twyford will have the smallest sphere of influence and functional index, as it is not a large settlement and cannot support a large range of high and middle order services and goods. I think that people travel further for higher order goods and services, and do not travel as far for lower order goods and services. Therefore Twyford will have a smaller functional index than Reading or Maidenhead.
Method:
Fifteen settlements were visited and the number and type of each service (for example clothes shops, restaurants etc) were recorded. This will show which services are available to people visiting this settlement. Each service was high order (eg-Department store or hospital), middle order (eg-restaurant or supermarket) or low order (eg-News agents or general store). Low order was given one point, middle order was given two points, and high order was given three points. The points were added up and recorded for each settlement. This information was then used to give a functional index for each settlement, which shows the number of services of low, medium, and high order in each settlement. The information given by the functional index shows which settlements more people are likely to visit and which settlements people are most likely to travel further to visit. For example, somebody would be less likely to travel a long distance to buy a low order good (such as a loaf of bread), but would probably be prepared to travel a further distance to purchase higher order goods such as clothing or shoes. The same can be applied for a high order service, and we can find out how far people are prepared to travel for services such as a doctors, dentists, or accountant, for example.
The data produced from collecting the functional index will be used with the spheres of influence of Twyford, Maidenhead and Reading to test my hypothesis.
The spheres of influence will be plotted using data which I have collected using questionnaires. The questionnaires are used to find out where the people visiting each of the four settlements have travelled from. The survey can be extended by finding out which age groups generally visit each settlement and which method of transport was used. We can also find out the purpose of peoples visits, which will show us how far people are prepared to travel for higher order goods and services. This shows the accessibility of the settlement. The purpose of their visits can also be ...
This is a preview of the whole essay
The spheres of influence will be plotted using data which I have collected using questionnaires. The questionnaires are used to find out where the people visiting each of the four settlements have travelled from. The survey can be extended by finding out which age groups generally visit each settlement and which method of transport was used. We can also find out the purpose of peoples visits, which will show us how far people are prepared to travel for higher order goods and services. This shows the accessibility of the settlement. The purpose of their visits can also be found, which can be useful in showing how far people travel for higher order goods and services. The questionnaires will all be taken at the same time, to ensure a more reliable set of results. I will take all of my questionnaires on Saturday afternoons, which is when most people will be in the main shopping centres of each settlement.
The data from the questionnaires is used by plotting the places where people have travelled from onto a map. This forms the sphere of influence. I will compare the size of the spheres of influence and find out whether these match my hypotheses. I will also compare the sizes of the spheres of influences to the functional indexes to test my hypotheses.
The last piece of data I will collect will be the population size of each place, as I will use this to test my hypotheses. This data will be compared with the spheres of influence and the functional indexes of Reading, Maidenhead, and Twyford, and compared to the functional indexes of the other settlements used (as questionnaires were not taken in these remaining settlements). I will find these by looking up the information on the council's websites.
Location:
The places I will use in my investigation are:
-Shiplake
-Reading
-Newbury
-Winnersh
-Earley
-Caversham
-Marlow
-Charvil
-Wargrave
-Maidenhead
-Henley
-Wokingham
-Sonning
-Woodley
-Twyford.
I shall be taking questionnaires in the following settlements:
-Twyford
-Reading
-Maidenhead
I am using these settlements in my investigation as they are easily accessible to me, and are within my ability to manage functional indexes and surveys.
Shiplake is a very small village. It does not appear to have many shops or services, and is mostly a residential area.
Reading is a very large town with a lot of shops. Around the town centre, there are many shops and restaurants. This attracts many people, so the town centre is quite crowded.
Newbury is quite a large town. It has many shops and restaurants.
Winnersh is a smaller town which is mostly residential. It has a few shops.
Earley is also mostly a residential place although it has some shops and services.
Caversham is a larger settlement with a large residential area and a small town centre with a few shops and services.
Marlow is quite a large town with a relatively large town centre.
Charvil is a very small village with hardly any shops.
Wargrave is also a very small village although it has a small town centre.
Maidenhead is a large settlement with a lot of shops and restaurants in the large town centre.
Henley is a medium-sized settlement. It is quite a picturesque town. It has a town centre with a few shops and restaurants.
Wokingham has a town centre with a few shops. It also has a large residential area.
Sonning is a very small picturesque village. It has a few restaurants but not many shops.
Woodley is a medium-sized town with a shopping precinct containing a few shops.
Twyford has a few shops, although the town centre is quite small. It has a larger residential area.
Results
Functional indexes of the settlements
Functional indexes Population size
Reading-585 143,520
Maidenhead-443 51,713
Marlow-406 8,000
Newbury-392 30,063
Wokingham-311 30,209
Woodley-140 26,118
Caversham-129 11,820
Twyford-121 6,294
Henley-113 10,000
Earley-117 29,958
Wargrave-29 3,840
Winnersh-19 7,643
Sonning-18 1,550
Charvil-7 2,442
Shiplake-5 1,521
When we compare the functional indexes of each settlement to their population sizes, it shows that the larger the settlement is, the larger its functional index will be, as my hypothesis states. It shows a general trend where when the population is higher, the functional index will be higher, although this is not always the case and there are some results which do not support my hypothesis, such as Marlow, which has a very large functional index (of over 400) compared to its relatively small population of 8,000. Twyford had a larger functional index than I expected, as its population is relatively
I took the functional index of each settlement. I took the functional index of each place by recording which shops and services were in each of the settlements. Larger settlements had much larger functional indexes than the smaller settlements. For example, Charvil is a very small settlement (with a population size of 2442). Its functional index is only 7. Reading is a much larger settlement with a population of over 143,000. The functional index of Reading is 585, which is much higher than that of Charvil. These results support my hypothesis. The larger settlements can support a higher number of shops and services. Also, because I have ranked the shops and services so that higher order shops and services have a higher score, the functional indexes show that Reading, as it is a larger settlement, can support higher order goods and services. These results show that my hypothesis is correct, and that higher populations can support a larger number of higher order goods and services.
The table below shows which settlements have higher, lower, and middle order goods. This explains why some of the towns with smaller populations have higher functional indexes.
Settlement
Low Order
Middle Order
High Order
Reading
79
94
34
Maidenhead
43
10
30
Newbury
61
11
27
Wokingham
53
99
29
Earley
26
31
0
Woodley
30
53
22
Caversham
45
46
0
Henley
51
23
34
Winnersh
9
5
Twyford
26
30
20
Wargrave
4
2
4
Charvil
9
2
0
Shiplake
3
0
Marlow
30
96
30
Sonning
7
7
0
The table shows that generally in the larger settlements like Reading and Newbury there are more middle order shops and services than lower and higher. The smaller settlements mostly contain lower and middle order shops and services, and hardly any higher order shops and services, although there are a few exceptions to this, such as Twyford, where although it is a small town, contains a few higher order shops and services such as antique shops. Another example of a result that does not support my hypothesis is Henley. Although it has a much smaller population than a settlement like Earley or Woodley, it has a functional index that is around the same. This result was not expected as the population seems too small to support all the higher order shops. An explaination for this could be that Henley is a tourist town, and relies on tourists rather than its own population to support the shops and services. Because of the tourists, there is a greater demand for the shops and services. Also, Woodley and Earley appear to have very small function indexes for their populations, although this is probably because they situated quite close to a larger settlement (Reading), and they are mostly residential towns. As they are situated close to Reading, the people living in Earley or Woodley would travel to Reading for some middle order and most higher order goods, although they would stay in the smaller settlement for lower order goods and services. This supports another of my hypotheses, the people travel further for higher order goods and services.
Sphere of Influence and survey results
The sphere of influence of Reading is much larger than the sphere of influence of Maidenhead and Twyford. This result supports my hypothesis. According to the central place theory, the larger the population size is, the greater number of shops and services the settlement will have. There will be a lot of shops in Reading's town centre, and more are likely to be higher order. This is because the more people there are, the more shops and services can be supported by the higher population. The sphere of influence is large as people from surrounding settlements are attracted by the higher order goods or services for which they are prepared to travel further for.
Smaller settlements like Twyford have a smaller sphere of influence. Twyford has a smaller population. Taking into account the central place theory in my hypothesis, a smaller population cannot support as many shops and services, and these will be more likely to be lower and middle order goods rather than higher order. The population of Twyford cannot support higher order goods and there is no need or demand for them. Therefore people are not prepared to travel to Twyford from a long distance away. Hence the sphere of influence is smaller.
Maidenhead has a relatively large population and the sphere of influence reflects this. There are a lot of shops ion Maidenhead's town centre, including shops selling higher order goods such as department stores. Maidenhead's town centre mostly contains shops and services which are middle order, so the sphere of influence is not as large as Reading's, although some people do travel further than they would for a smaller settlement such as Twyford. The higher population in Maidenhead also means that there will be a greater number of shops and services, as there is more demand due to the higher number of people in the settlement.
I calculated the average distance travelled by people travelling to the settlements which I found the spheres of influence for.
Twyford (functional index-121): 1.6 miles
Maidenhead (functional index-443): 6 miles
Reading (functional index-585):
These results show that people are prepared to travel further to get to larger settlements with higher functional indexes. This means that people travel further to get to the settlements which are more likely to have higher order goods and services. This supports my hypothesis.
Sphere of influence
On one of my maps I have drawn the sphere of influence of each settlement as lines. The lines are thicker where more people have travelled to each place. This shows that more people travel from nearby places to places that are smaller (eg Twyford). The lines are thicker and shorter around Twyford and longer and thinner around Reading. This is because people travelling to Reading come from further away and from lots of different places, whereas people travelling to Twyford tend to come from nearer to Twyford, and from a smaller variety of places.
Pie charts showing where people travelled from to reach Twyford, Maidenhead and Reading
These pie charts show where people have travelled from to visit the settlements. I took this information from the questionnaires. The pie charts show that people travel to Reading from a greater number of different settlements. In my survey I found that people had travelled from 14 settlements to get to Reading, which backs up my results from the spheres of influence. People travelled from 8 settlements to visit Maidenhead, and people travelled from 7 settlements to visit Twyford. I also noticed that more people found in the smaller settlements were from that settlement, and therefore had not travelled very far at all. Also, people travel from further away to visit Reading, which is the largest settlement, Reading. These results support my hypothesis, which states 'People travel further for higher order goods and services, and do not travel as far for lower order goods and services'.
Population sizes
I collected these population sizes by finding them on council websites. I collected population sizes in order to gain an idea of how large each settlement was. This data is also very useful when used to compare with functional index and sphere of influence/survey results.
Reading-143520
Newbury-30063
Maidenhead-51713
Wokingham-30209
Earley-29958
Woodley-26118
Caversham-11820
Henley-10000
Winnersh-7643
Twyford-6294
Wargrave-3840
Charvil-2442
Shiplake-1521
Marlow-8000
Sonning-1550
Evaluation of investigation
There are many ways in which I could improve my investigation, although on the whole I am quite pleased with my results. My functional indexes are probably not very accurate as I took them from the main shopping centres of nearly every settlement. A lot of settlements will also have shops outside the main shopping centre. I would not have counted these shops and services in my functional index.
Another thing which could have affected my results is that conditions such as the weather could have affected my survey. Less people are likely to be out in my chosen settlements if it was raining, for example. Also, my population sizes are not very accurate, as the values which I have are probably out of date, although they are from a reliable source.
To improve the accuracy of my results I could do a survey of which shops and services are situated outside the main town centre of the settlement or I could make sure I have seen the whole of the settlement and recorded each shop or service in the area, although this would be difficult due to time limitations. It is also difficult to take questionnaires at exactly the same time on the same day each week, and it is impossible to take each questionnaire in exactly the same conditions as the other. I cannot improve the accuracy of the population values as they are estimates taken from other sources, and I cannot calculate the population size of each settlement myself. Also, population estimates become unreliable and inaccurate quite quickly. I think that I would need to take more than 25 questionnaires in each settlement and use more than 15 settlements in this investigation to properly prove my hypotheses accurately.
To extend my research I would need to research the accessibility of each settlement. I would also take a bi-polar analysis of each place. Due to time limitations I could not extend my research, although I am quite pleased with my results, as my Spearman's Rank Correlation Coefficient showed that the correlation between the population size and the functional index was 99.9% likely to not have occurred by chance.