Data collection method
Data analysis
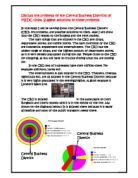
Table interpretations on the map of Newcastle Gateshead.
Table 1
Table 1 had the highest total pedestrian count (367 in total), the second count was higher (by 7) than the first count. This shows that Transect 1, Northumberland Street, was the busiest street in that day. I believe this is because of all the shops and this relates to why The CBD has a high SOI.
Table 2
Table 2 has the lowest total Pedestrian count (90 in total). This shows that this street was the least busy of the three transects, this is logical as this street had the lowest amount of shops and popular services.
Table 3
Table 3 has the median total pedestrian count (125 in total) this shows that the street must have had some services that the general public use, with a higher shop count than transect 2, it is logical to assume that it is more popular because of its shop count. This seems to suggest that the greater number of shops, the greater the population of pedestrians there is.
How often do people visit Newcastle?
This graph shows that the majority of people visit the CBD once a week or 2-3 times a week. This shows that that transect is very popular.
This graph shows that this individual transect is extremely popular because the vast majority of pedestrians questioned, visited that transects 2-3 times a week. I believe this could be because of all the services it offers.
This transect was not as popular; however it still had a high majority that visited the CBD often. This shows that the more services a CBD offers the greater the SOI is.
Mode of transport
The ability to get to a place and the ease of it increases the chances of more people visiting that place. Newcastle itself has a wide range of transport options the most popular probably being public transport, it’s easier and also cheaper than but not as convenient as private.
The graph shows the majority of pedestrians questioned got to the CBD by means of public transport (bus and metro). This shows that at that time the people that were questioned got probably the easiest means of transport, and with buses and metros increasing, the amount of people that could get into the CBD from greater distances increase.
Data interpretation
What is the range of shops and services on offer?
The land use in Newcastle’s CBD is large and varied. The variation includes:
- Comparison shops
- Food shops
- Specialist shops
- Financial serves
- Estate agents
- Health services
- Convenience shops
- Pubs
- Clubs
- Restaurants
- Cafes
- Household Shops
- Cinemas
- Legal services
Out of the range of shops, the most common is comparison shops, however, health services and entertainment ranges this is because they take up much more space and are expensive to setup.
Larger land uses are unique to the CBD like Marks and Spencer and Specialist Clothes shops. These are unique because they are not usually found in small towns and villages.
These unique land uses are found in the CBD because of low land prices. Also because Newcastle has a very good accessibility and therefore easy to get to.
The threshold population contributes to this. Land use does vary between the 3 transects for example, Northumberland street and is a prime location, has larger shops and it’s the most expensive out of the 4 streets to rent. Grey Street is the least busy according to the pedestrian count but it’s much busier with cars. Grey Street does not have many comparison shops and more specialist shops, some of the land use of these transects are not found such as, universities, colleges, hospitals or football grounds.
There is an almost definite link between land use and pedestrian count. I believe this is because there are a lot of specialist shops so a lot of people would be in a street where there are more shops, theoretically, that suit them. There were a higher number of pedestrians in the streets with the most specialist shops/department stores.
My results were expected, as stated, I believed the busier streets were, the ones with department stores and specialist stores, which was confirmed because the streets with the higher pedestrian count were the ones with the department stores.
Why do people visit the Central Business District?
The most common reason for people visiting the Central Business District was to shop, eat/drink and to go to work. This ties to the transects quite logically as there is a higher count of shops, restaurants and places of work than anything else. This could be due to the time that the Questionnaires were done. If the questionnaires were done early on in the day, e.g. before business hours the results would be more skewed towards work. If the questionnaires were done on a Friday night it would be skewed to other which probably would mean Drinking/Clubbing. I did not expect anyone to be in town for religious reason as it was not an obvious religious day.
The most common use of transport was public busses/transport and cars. This is as expected as there are more facilities for these two forms of transport than anything else. This form of transport is used because it can get a high number of people into the Central Business District from most locations in the north east area, and still be inexpensive also. An example of this is Newcastle Haymarket Bus station, and a few multi-story car parks, which are accessed by the major roads which are also near to the transects.
I believe there would be a link between the distance people, although my data did not get any evidence, people would travel further to get better deals and a better range of products. Personally, I travel 7 miles to buy clothes from town, people would travel a lot more for higher order goods.
These results were exactly as what I expected. Referring back to my introduction, the large sphere of influence is that people travel further to get what they want and more of a choice. The good points for people visiting the Central Business District would probably be that there is almost something for everyone’s need there. Looking back on the photos I can see that the more specialist shops and comparison shops there are the more people will visit that transect. This is quite a valid reason for a large sphere of influence and suggests that the good aspects of each transect is a genuine reason for people to visit it.
My personal opinion of each of the transects is that they need re-modernizing, this agrees with some of the pedestrians answer of “ugly”, however with redevelopments planed for the future Newcastle’s CBD will soon look modern and attractive.
What is the extent of Newcastle’s sphere of influence?
The spread of mode of transport is between public transport (busses/metros) and Cars. This was expected as these are the most obvious form of transports. This was apparent in all of the transects looking back on the Mode of transport graph. The furthest anyone had traveled from was Berwick and his purpose of visiting the Central Business District was shopping. This backs up my idea that people would travel far for shopping, this shows that Newcastle’s sphere of influence reaches as far as Berwick!
The land-use and the distance people traveled didn’t change in my investigation, however thinking logically, people would travel further for things such as electrical stores, and Theaters.
I believe each street and even possibly each shop have its own sphere of influence. This is because certain shops, e.g. USC (clothes shop) have its own sphere of influence, because they attract people from all over North Tyneside to shop there. Night clubs and other tourist attractions such as St. James Park can attract people from all over the world! Newcastle supporters in other counties could fly over just to see them play.
Overall, I believe Newcastle and its Central Business District has a large sphere of influence due to all of the reasons I have discussed, including accessibility, tourist attractions, wide variety of shops and nightlife. The sphere of influence and everything that makes Newcastle the great city it is, continues to grow, expand and develop.