Land use survey Train time table
Traffic Count Maps
Photographs
I collected my primary data on a Thursday and Friday in the summer holidays. I chose to do it at this time because I had free time in the holidays. Doing it at this time of the year meant more people were on holiday or not at home. This meant finding people to survey was more difficult and I had to go to more houses than I intended. I believe that the weather affected my data capture, because it was summer and we were fortunate enough to have good weather, people may have been inclined to spend more time away from their home. I conducted a pilot study to find out how far people travel to work, what shops and services people use and what type of house they live in.
Primary Data 1: Interviews Done By Me
I made a questionnaire to survey people travel habits, how far away they work and what local sops and services they use. For me this is the most important data collection method I used. I think this because it can tell me a lot about the people who live in East Horsley, this is the type of information I cannot look up in a book or on the Internet.
The first question I asked was ‘How far away do you or a member of your family work?’ This is the main question which determines whether they are commuting to work or not, or if they have moved to Horsley to retire or simply for a more pleasant lifestyle. The next question I asked was ‘How long have you lived in this area?’ This will show me the amount of growth in Horsley in recent years when I believed it has developed a commuter village status. The third question I asked was ‘Why did you choose to settle here?’ I will look at what people have said and I hope a will find similar results which will back up my prediction. The fourth question was ‘What shops and services do you use?’ I hope to find that large amounts of people use the more specialised shops and services; this may indicate Horsley as being a commuter settlement. Questions 5&6 are about the advantages and disadvantages of living in Horsley, again I hope the results will back up my prediction. The last question was ‘When was you house built?’ Hopefully my data will show that there has been an increase in houses built in the last two decades, this might be because of a demand for housing in recent years as Horsley has attracted more inhabitants.
I selected the houses to survey at random but I made sure to make the area I surveyed broad to give an idea of the whole of East Horsley rather than just one road.
Here is a copy of my questionnaire once filled in:
Primary Data 2: Land Use Survey
This shows what employment activities occur in the village. I looked at what buildings are and recorded what they are used for. I made a map using roughly a 1:10,000 scale and used different colours, shades and symbols to the function of each building. I plan on making a pie chart to show the percentage use of each function.
Primary Data 3:Photographs Taken By Me
I took photographs of shops and services around East Horsley Village. I also took photographs of some houses and residential areas.
Primary Data 4:Traffic Count
I have taken two traffic counts at different times of the day: one at rush hour 5pm to 6pm and one at 2pm to 3pm, this should show me that there is more commuter traffic in the rush hour. This will show me if there is an increase in traffic at rush hour and if it substantial enough to show the likelihood of Horsley being a commuter village.
I collected all of my data individually apart from the questionnaire, which a friend helped me with, this made it a lot easier because he could record data whilst I asked questions.
Secondary Data:
I acquired a bus and train timetable and maps off of the Internet. This helped me because they show how many busses and trains go, and where they go.
Data Presentation/Interpretation
Primary Data Set 1: Questionnaire By Me
(figure 4)
This pie chart shows that over 50% of the people I surveyed work 21-40 miles from home, this clearly indicates that they are commuters and travel to places like London to work. This is what I predicted.
(figure 5)
This chart shows that around 60% people have moved here in the last 10 years, this might be because of the large increase in houses in this area in that time span. This is a clear sign of growth for East Horsley in the last decade.
Question 3:Why did you choose to settle here?
Although this data is hard to present graphically, 18 people answered the question with an answer similar to ‘We moved here to escape the hectic city life and retreat to the more rural areas’ or ‘It is also close to the A3 and M25 and has a train station very near by.’
(figure 6)
This bar graph shows how many people use the shops and services in East Horsley. One of the most frequently used is Budgens, I expected this but I did not expect so many people to use the train station, this denotes that a lot of people might use this for commuting to work. The bank and the hairdressers are the next two highest but these are things most people would use. Another surprising result was that over half of the people I surveyed use the dry cleaners and the pizza restaurant.
Questions 5 & 6:
These two questions were about the advantages and disadvantages of living in East Horsley, for the advantages, most people referred to the fact that it is clean, quiet and peaceful most of the time, and is also out of the city. People also commented again on the importance of the A3, M25 and train station that are all close. The only real disadvantage was the lack of specialised services.
(figure 7)
I expected that the data I collected should have shown the increase of houses built roughly in the last 22 years, this would indicate the amount that East Horsley’s population has grown in the last two decades. As I predicted this was the case, and I think this was definitely one of the most useful pieces of data I collected.
Primary Data Set 3: Photographs taken by me (figure 6)
Primary Data Set 4: Traffic Survey(figure 7)
This traffic count clearly shows that there is generally a lot more traffic in the rush hour but this was expected, but to be more precise there is an amazing increase in the number of cars, this is most likely due to people returning home after their commuter jobs.
Secondary Data Set 1 & 2: Bus and Train Timetables
I retrieved bus and time tables from my local council library.
Bus timetable
The bus timetable I have shows that the buses passing through Horsley go from Guildford to Epsom and from Epsom back to Guildford, although these are two large towns in Surrey the buses running to East Horsley are quite irregular during the day time with large gaps where no buses run, but in rush hours there is at least one bus an hour. This does not support my prediction but does not but does not reject it either. Another factor to consider is where the bus stops are. There are no bus stops in East Horsley village but there are some on the outskirts of the residential area. This may be due to the fact that the buses aren’t needed because they only travel to Epsom and Guildford and not London.
Train Timetable
All the trains that leave Guildford station toward London pass through Horsley. This makes Horsley an ideal place for commuters to live because from Monday-Saturday trains run every 35 minutes. This backs up my hypothesis.
Secondary Data 3: Maps
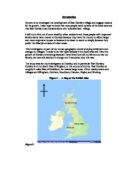
The following annotated maps show that Horsley is well within commuting distance.
Conclusion
In my aims I wanted to investigate the development of East Horsley village and suggest reasons for its growth, I have shown that this is true in figure 2 & 4 above. Reasons for Horsley’s growth were shown in questions 3, 5 & 6 in my questionnaire above. I also hoped to show that most people work outside of the local area and I proved this in figure 1 and also figure 7. East Horsley does have characteristics of a suburbanised village, like the large amount of shops and services shown in figure 5 and 6. East Horsley also has a lot of modern housing, one example of this is shown in figure 6. My results were largely as I expected but some were surprising but still backed up my aims and predictions. Largely, my data collection is very generalised and may not be accurate for showing the percentage of commuters living in Horsley; but for me it is clear most people living in Horsley are commuters.
At the time when I was collecting my primary data I was satisfied that I had enough, as I got further into my investigation I realised that more primary data would have lead to more conclusive findings. I would ideally have done a lot more surveys but found this too time consuming. Another disadvantage of using pilot studies was that not all the answers were easily categorised; and when I reviewed them I realised I could have made the questionnaire more extensive i.e. ‘what bracket their house price falls into.’ The only problem I had collecting data was that my choice of time to survey East Horsley meant a lot of people were away from their homes, although the data I managed to collect was very useful. If I was to repeat my study, I would improve my enquiry by finding historical maps and comparing them to recent ones, this would aid me to show the growth of the village.
I believe my results to be accurate and my methods conclusive. This is because I actively questioned residents. The only reason my pilot survey would be flawed is if they had lied, but I doubt this because the results were substantiated by my prediction.
All of my results, particularly my questionnaire back up my hypothesis because they show convincingly that Horsley is commuter settlement with exclusive housing and consumer goods and services. None of my results reject my hypothesis but I found the secondary data to be a lot less useful. For example the bus timetable only showed me the fact that busses run from Guildford to Epsom every hour and this did not aid my investigation.
To increase the accuracy of my results I would have to:
- Add more questions to my questionnaire
- Survey more people
- Count more traffic
Count traffic at more time intervals