- Clothes and shoe shops dominate the retail outlets within the survey area
The land use survey that will be conducted to prove or disprove the first hypothesis will also be used to explore this hypothesis. The categories used to group the premises into similar land usages will help to recognise if this hypothesis is correct. A transect survey will be conducted which could be used both for this hypothesis and hypothesis one. A point will be chosen that is closest to Bury’s retailing core and then the shops will be recorded as I walk out of Bury’s retailing centre.
- Shops selling comparison goods tend to locate next to or close to each other in order to attract custom
The land use survey that will be conducted to prove or disprove the first and second hypotheses will also be used to explore this hypothesis. It will be evident if two different shops sell comparison goods when the categories they are grouped into are compared. If this hypothesis is correct, it will be seen that there are many shops from the same category clumped together. Different colours will be used to represent each category and hopefully this will make it easy to see when there are many shops of the same category together. A cluster and anti-cluster survey will also be conducted during the visit to Bury. A base map of two retail areas that displayed the cluster and anti-cluster effects will be drawn. A nearest neighbour analysis (NNA) will be conducted to investigate this hypothesis. A specific area will be chosen, to carry out this statistical survey. An area will be chosen that appears to have one type of shop dominating the premises. To work out the distribution pattern, the following are needed for the formula: R=nearest neighbour coefficient, D=mean distance to nearest neighbour, N=total number of neighbours within survey area, A=total area of study. D will be worked out by pacing the distance from the middle of one shop to the middle of the nearest shop in the same category. The total will then be added and divided by N. This is the mean distance to the nearest neighbour. It will be assumed that one pace=one metre. To calculate the survey area, the scale factor of 1cm:10m from the original base map will be used. An attempt will be made to “enclose” the survey area within a number of regular shapes. Once the answer to the formula is worked out, the distribution of shops can be classed as: clustered (0-0.6), random (0.6-1.5) or uniform (1.5-2.5). I think that it would be better if the distance from the nearest neighbour could be measured using a tape measure, however, due to safety reasons, this will not be possible. Different people have different lengths of strides and, furthermore, one person cannot fully regulate their stride lengths over an area. I also think that working out the survey area will also be inaccurate, as there will be awkward shapes that will not be able to be accommodated for and will therefore have to lose or add on some measurements.
- With increasing distance from the peak land value point, pedestrian flow will decrease.
To prove or disprove this hypothesis a pedestrian count will be conducted within the area being studied. To do this I will be stood at a certain point within the area being studied and the number of people that pass during a certain period of time will be counted. This will be done on both the first and second days of my inquiry, as the first day will be a non-market day and the second will be a market day. This will be done during both the morning and the afternoon, as it can be expected that different results will be found at different times of the day. I will be stood at the designated point with a partner, and at a previously agreed time (synchronised with the rest of the group who will be positioned in different areas) will start the pedestrian count. The number of pedestrians passing will be recorded on a tally chart. If there are large numbers of people, it may be difficult to count them and write down the findings at the same time without making mistakes. Therefore, only when ten people have passed will the results be written down, providing time to record the correct numbers. I expect there will also be discrepancies regarding the synchronisation of the people in the group, as the times on the different watches will not all the be the same and so each person will be starting and finishing their pedestrian count at a different time. The rateable values of the shops nearest to each pedestrian count point will be used to establish the value per m2 of the location. The rateable value of each retail premises can be found on the Internet. A scatter graph will then be used with a line of best fit to visually compare the correlation between the two variables and then Pearson’s Correlation Coefficient will be used to establish the exact relationship between them.
- The area will be busier on market days than on non-market days. Furthermore, it will be the areas closest to the location of the market that will see the highest percentage increase of pedestrians.
To prove or disprove this hypothesis a pedestrian count will be conducted within the area being studied. To do this I will be stood at a certain point within the area being studied and I the number of people that pass during a certain period of time will be counted. This will be done on both the first and second days of my inquiry, as the first day will be a non-market day and the second will be a market day. This will be done during both the morning and the afternoon, as I expect that different results will be found at different times of the day. I will be stood at the designated point with a partner, and at a previously agreed time (synchronised with the rest of the group who will be positioned in different areas) will start the pedestrian count. The number of pedestrians passing will be recorded on a tally chart. If there are large numbers of people, it may be difficult to count them and write down the findings at the same time without making mistakes. Therefore, only when ten people have passed with the results be written down, providing time to record the correct numbers. I expect there will also be discrepancies regarding the synchronisation of the people in the group, as the times on the different watches will not all the be the same and so each person will be starting and finishing their pedestrian count at a different time.
- A person visiting Bury Shopping Centre from nearby will use public transport. A person travelling over a longer distance will use a private car. The tram route will only attract people who live near stops that are close to Bury.
The questionnaire will also be used to prove or disprove this hypothesis, as within the questionnaire there will be questions relating to place or origin and method of transport used to access the area. The questionnaire will be handed out throughout the inquiry and so, hopefully, a fair picture will be gained of the results across the length of the investigation. The questions within the questionnaire that relate to this hypothesis will be: “Where do you live?” and “What method of transport did you use to get here?” I think the first question will be problematic as “Where do you live?” is quite a vague question, and although there will be sub-questions of “Town?” and “City?” this may not be detailed enough, especially for people travelling from within Bury. If this question does, in fact, turn out to be as problematic as predicted, I intend to conduct a second questionnaire based solely on place of origin and means of transport used to access the area. It will consist of two questions: the first being a more specified origin question including street name and area and a question relating to means of transport. This questionnaire will be conducted in the following places: several car parks around Bury’s CBD, the Bury Bus Interchange and Bury’s Metrolink station. As these questionnaires will not be conducted all at the same time, the results will be different for each survey. The information will then be presented on individual isoline maps of Manchester for each method of transport.
Questionnaire
1. How old are you?
□ Less than 18
□ 18-30
□ 30-60
□ 60+
2. Are you male/female?
□ Male
□ Female
3. Where do you live?
Town ________________ City ________________ County ______________
4. What method of transport did you use to get here?
□ Car
□ Train
□ Metrolink
□ Bus
□ On foot
□ Bicycle
□ Coach
□ Other If other please state: ___________________________
5. How long did your journey to Bury today take?
□ Less than 15 minutes
□ 15-29 minutes
□ 30-59 minutes
□ 1 hour – 1 hour 29 minutes
□ 1 hour 30 minutes – 1 hour 59 minutes
□ 2 hours or more
6. Why have you come to Bury today? (tick as many as applicable)
□ Shopping
□ Entertainment
□ To eat out
□ To use a bank
□ To visit the Citizen’s Advice Bureau
□ To meet someone
□ To use services (e.g. phone repairs, opticians etc.)
□ Other If other please state: ___________________________
7. If you have come to Bury to shop, what have you come to buy?
□ Not come to shop
□ Clothes/shoes
□ Services
□ Jewellery/watches
□ Stationery/cards/books
□ Gifts
□ Health and beauty (incl. opticians)
□ Food
□ Electronics
□ Other If other please state: ___________________________
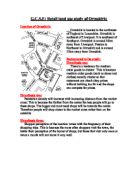
Shop categories map
Shoes – 11
Electronics – 12
Jewellers/fashion accessories – 15
Food/cafes – 24
Specialist shops – 17
Books/cards/stationery – 20
Health/beauty – 14
Large stores/supermarkets – 5
Charity shops – 3
Newsagents – 4
Housewares – 4
Sports shops –
Services/banks (non-retail) – 50
Total 211
Analysis of Base Map Results
Shop Category Base Map Analysis
Clothes shops occupy 18.8% of the retail outlets within Bury’s pedestrianised zone (31 of 165 units)
Retail/Non-retail Base Map Analysis
Retail/non-retail map
Retail – 165
Non-Retail – 46
Total - 211
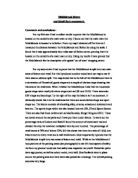
Nearest Neighbour Analysis
The purpose of this section of the study was to identify the patterns of distribution of shops and services. Whilst a simple plan of the study area will help to identify the most dominant shop or service category, a more thorough way of measuring the pattern of distribution would be to apply a recognised statistical technique. One such technique is the ‘nearest neighbour analysis’. This is a way of calculating whether the distribution pattern occurs as:
A cluster
Random distribution
Uniform distribution
In order to do this, data must be collected and introduced into the formula. To collect this data ‘D’, which was the mean distance to the nearest neighbour, had to be calculated. This was accomplished by pacing the distance between the middle of each nearest neighbour. The number of neighbours reviewed was then counted up for ‘N’ and the total area ‘A’ was then calculated using the base map. Once each of the figures had been gathered each was put into the formula as shown below:
R=2D√(N÷A)
Where:
R = nearest neighbour coefficient
D = mean distance between neighbours
N = number of neighbours reviewed
A = total area reviewed
To obtain ‘R’ the following range of answers are necessary:
0→0.6 = cluster
0.6→1.5 = random distribution
1.5→2.5 = uniform distribution
The chosen area revealed a dominance of clothing shops. Of the 24 units surveyed, the results were as follows:
Results of Nearest Neighbour Analysis
Calculations
To calculate the survey area, the plan was boxed off into manageable rectangles, to make calculating the survey area possible.
Area 1 = (30mx45m) = 1350m2
Area 2 = (70mx20m) = 1400m2
Area 3 = (40mx40m) = 1600m2
Area 4 = (30mx60m) = 1800m2
Total area of survey = 6150m2
On application:
R=2D√(N÷A)
R = 2(11.36)√(11÷6150)
R = 22.72√0.0017886
R = 22.72 x 0.042292054
R = 0.96
(correct to 2 decimal places
The answer of 0.96 confirms that the clothes shop category dominates in a uniform distribution.
Pedestrian Count Results
Isoline map 1
Isoline map 2
Isoline map 3
Isoline map 4
Pedestrian Count/Day
Isoline map of percentage differences
N.B. I have omitted pedestrian count point 1 as I could not produce a land value for this location. Therefore, it will not be included in any further calculations.
For the fourth hypothesis, pedestrian flow will be compared to value/m2 to investigate the correlation between the two. It is expected that there will be a positive correlation; however it is not clear as to what extent this will turn out to be true.
To measure the correlation, Pearson’s Correlation Coefficient will be used. The equation for this is:
Pearson’s Correlation Coefficient is the best measure of linear correlation. Microsoft Excel will be used for the calculations, the function being =PEARSON(x values, y values)
The correlation coefficient r will be -1≤r≥1 where -1 is an absolute negative correlation and +1 is an absolute positive correlation.
Pearson’s Correlation Coefficient was calculated to three decimal places, as follows:
0.073356436
This result was very far from the result expected and so the anomalies will now be excluded from the calculations to see how the result changes.
The results for the following pedestrian count points will be omitted:
Pedestrian Count Point 6
Pedestrian Count Point 8
Pedestrian Count Point 16
Pedestrian Count Point 18
These anomalies have been highlighted on the “Land Value/m2 Against Number Of Pedestrians” graph.
These anomalies can be explained in the following ways:
- Pedestrian count point 6 is at the end of a long, thin corridor leading only to public toilets and outdoors to an area of very little interest. This explains the low pedestrian flow. However, it is located next to the Marks and Spencer’s department store which raises the land value dramatically. There is no entrance to the department store near to the pedestrian count point.
- Pedestrian count point 8 is at an exit that leads onto Crompton Street (with very few shops) and to a square with seating for the public. There is no parking accessible from this exit. It is on the periphery of the covered area of the shopping centre. Therefore, the land values are still high, but due to the lack of shops to attract pedestrians to this particular exit, the pedestrian flow is low.
- Pedestrian count point 16 is at the entrance to the walkway mentioned for pedestrian count point 6. The reasons for low pedestrian flow at this point are therefore the same as those for pedestrian count point 6; the corridor leads only to public toilets and to an exit point to an area of very little interest. The land value is very high however, due to the location being directly next to Marks and Spencer’s department store.
- Pedestrian count point 18 was at the exit of Union Arcade. Parking is not accessible from this exit and although the market is directly opposite, there is no entrance to the market hall. The location is on the periphery of the covered shopping area and so the land value is high, but as there is very little to attract pedestrians to the area, the pedestrian flow is low.
The same calculation as before, using Pearson’s Correlation Coefficient, will be used, omitting the anomalies mentioned.
Pearson’s Correlation Coefficient was calculated to three decimal places, with the afore mentioned anomalies omitted, as follows:
0.468129802
This result shows a fairly weak positive correlation. However, it supports the fourth hypothesis far more than the original result, which showed a slightly negative correlation. The second result will therefore be used for the continuation of the study.
Metrolink
Bus
Car
Isoline map of Manchester page 2
Isoline map of Manchester page 3
Isoline map of Manchester page 4
Questionnaire Results for Question 7 – “If you have come to Bury to shop, what have you come to buy?”
The categories above will be split into high-order, medium-order and low-order to make it easier to prove or disprove my hypothesis of, “Purchases will be of higher order goods on non-market days than on non-market days,” as follows:
With the results above I produced the following bar chart:
Data Interpretation
Hypothesis 1:
“The main function of the Bury’s pedestrianised zone is to provide a retail outlet.”
Both the “Retail/non-retail” land use map, and the resultant tables and pie charts, were used to prove or disprove this hypothesis.
It can be seen at a first glance from the “Retail/non-retail” map that retail premises dominate the pedestrianised zone, as light green, the colour used to represent retail premises, dominates over any other colour.
This can be seen in a more reliable context in the pie chart on page… and the table on page…which show that retail premises occupy over 75% of the area studied.
This proves my first hypothesis in that it clearly shows that retail land use is the main form of land use within Bury’s pedestrianised zone.
Hypothesis 2:
“Clothes and shoe shops dominate the retail outlets within the survey area.”
Both the “Shop Categories” land use map, and the resultant tables and pie charts, were used to prove or disprove this hypothesis.
It can be seen from the “Shop Categories” map that clothes shops dominate the retail outlets within Bury’s pedestrianised zone, as light green, the colour used to represent clothes shops, dominates over any other colour used to represent retail outlets.
This can be seen in a more reliable context in the pie chart on page… and the table on page…which show that clothes shops occupy nearly 15% of the units within Bury’s pedestrianised zone and 18.8% of the retail premises within this zone. These percentages are the highest of any shop category, as can be seen from the bar chart and table referred to previously.
This proves my second hypothesis in that it clearly shows that clothes shops dominate the retail units within Bury’s pedestrianised zone.
Hypothesis 3:
“Shops selling comparison goods tend to locate next to or close to each other in order to attract custom.”
Both the “Shop Categories” land use map and the Nearest Neighbour Analysis were used to prove or disprove this hypothesis.
Several examples of the tendency mentioned in hypothesis 3 can be seen in the “Shop Categories” land use map. Two examples of this are the grouping of clothes shops along the “Kay Gardens Shopping Centre” row of units in the south west corner of the map, and the cluster of jewellers shops at the intersection of The Mall and The Haymarket.
The Nearest Neighbour Analysis, with the result of 0.96, shows that the area chosen to study; Union Arcade and the shops opposite, are arranged in a uniform distribution. This shows that the shops in the category “Clothes Shops” in the area are spread out at regular intervals across the region. This disproves my third hypothesis, in that the shops are not clustered as predicted. However, this study was only conducted over a small area of the shopping centre, and so this result is not necessarily conclusive. To confidently prove or disprove this hypothesis, a Nearest Neighbour Analysis would have to be conducted over the whole pedestrianised zone.
Hypothesis 4:
“With increasing distance from the peak land value point pedestrian flow will decrease.”
Both the four isoline maps for the four different time periods and the scatter graph, “Land value/m2 Against Number of Pedestrians” and the resultant investigation using Pearson’s Correlation Coefficient were used to prove or disprove this hypothesis.
It can be seen from the isoline maps that the colours used for the lower bounds of pedestrian numbers are generally on the outside of the map, while the colours used for the upper bounds are generally closer to the centre of the map. Assuming that the highest land values are at the town’s centre, this signifies that the highest number of pedestrians can be found at the peak land value point. This, however, is not a very reliable conclusion to make, as it cannot be accurately stated that the highest land value point is at the “centre” of the pedestrianised zone.
Therefore, my investigation using a scatter graph, line of best fit and Pearson’s Correlation Coefficient provides a more reliable conclusion. The scatter graph shows four clear anomalies. The reasons for the presence of these anomalies have been explained during my investigation using Pearson’s Correlation Coefficient. Excluding these anomalies, it can be seen that the scatter graph shows a clear positive correlation to the line of best fit. Originally, Pearson’s was used including the four anomalies mentioned. This showed an extremely weak positive correlation, and so the anomalies were removed and the result was recalculated. The second result was far closer to that expected and showed a fairly weak positive correlation. This proves that, in general, as land value/m2 increases, pedestrian flow increases.
This proves my hypothesis in that it shows that with increasing distance from the peak land value point, pedestrian flow decreases.
Hypothesis 5:
“The area will be busier on market days than on non-market days. Furthermore, it will be the areas closest to the location of the market that will see the highest percentage increase of pedestrians.”
The table, “Pedestrian Count/Day,” the bar chart, “Average Number of Pedestrians Per Day Per Survey Point” and the isoline map, “Isoline Map of Percentage Differences,” were used to prove or disprove this hypothesis.
It can be clearly seen from the table, “Pedestrian Count/Day,” that the numbers of pedestrians increase at almost every survey point between non-market days and market days. This is shown in a clearer format by the bar chart, “Average Number of Pedestrians Per Day Per Survey Point,” where the pink bars are higher than the blue for every survey point except one. This supports my hypothesis that the area is busier on market days than on non-market days.
The isoline map, “Isoline Map of Percentage Differences,” deals with the second part of this hypothesis. It can be seen from this map that the areas closest to the market are the areas that saw the highest percentage increase of pedestrians between the non-market day and the market day. This supports my hypothesis that it would be the areas closest to the location of the market that would see the highest percentage increase of pedestrians.
His proves my hypothesis in that it shows that the area is busier on market days than on non-market days and that the areas closest to the location of the market that see the highest percentage increase of pedestrians between non-market days and market days.
Hypothesis 6:
“A person visiting Bury Shopping Centre from nearby will use public transport. A person travelling over a longer distance will use a private car. The tram route will only attract people who live near stops that are close to Bury.”
Both the tables, “Metrolink,” “Bus,” and, “Car,” and the isoline maps for the study, “Origins of Visitors to Bury,” were used to prove or disprove this hypothesis.
It can be seen from the tables and isoline maps that, in general, the people that used Metrolink to access Bury’s centre had come from places that had Metrolink stops close to Bury (such as Prestwich), or were very near to Metrolink stops. Furthermore, the people that were asked at the interchange were generally from places such as Heywood, which were not accessible by Metrolink but were too close to Bury to economically use a car. The people interviewed in the car park were found to have originated from a much wider spread of areas.
This proves my hypothesis in that it shows that people visiting Bury Shopping Centre from nearby use public transport, people travelling over a longer distance use private cars, and the tram route only attracts people who live near stops that are close to Bury.
.Conclusion
At the beginning of this enquiry I stated that my aim would be to determine the roles and purposes of Bury’s town centre.
I found, from the investigations using the hypotheses agreed at the start of the enquiry, the following:
The main function of the Bury’s pedestrianised zone is to provide a retail outlet, with the majority of premises within this area being used for retailing. Furthermore, within these retailing premises, clothes and shoe shops dominate, occupying 18.8% of the retail premises within the area.
Shops selling comparison goods may tend to locate next to or close to each other in order to attract custom, however, in this study this trend was not found to be present in Bury’s pedestrianised zone.
In Bury’s pedestrianised zone, generally, with increasing distance from the peak land value point pedestrian flow decreases.
The area is busier on market days than on non-market days and it is the areas closest to the location of the market that see the highest percentage increase of pedestrians between non-market days and market days. Furthermore, with increasing distance from the market and the peak land value point, pedestrian flow decreases on market days.
Originally, I expected to find that comparison shops such as clothes and shoe shops would locate next to each other and that these clusters would be found at the highest land value points and where the pedestrian flow was highest. However, this was not found in my investigation and therefore I have concluded that Bury is not a ‘model’ shopping centre.
.Evaluation
There were several areas in which the reliability of my investigation may have been compromised:
The method used to determine whether retail or non-retail outlets dominated the investigated zone, and which category of shops dominated the area, was not very reliable for the following reasons:
-
Using a ground map meant that only the premises on the ground floor of each building were investigated. Therefore, if there were offices on the first floor, for example, this would not have been represented in the investigation. (To improve this aspect of the investigation I would try to include the floors above ground level in my assessment of land use)
-
The method used only took retail and non-retail into account, and no other land usages, so if the result had been that the main function of the area was not retail land use, it would have been very difficult to establish what the main use actually was. (To improve this aspect of the investigation I would establish the other land uses in Bury’s CBD before I began the investigation)
The methods used to determine whether shops selling comparison goods tend to locate next to each other were unreliable for the following reasons:
-
The nearest neighbour analysis was unreliable due to several inaccuracies of the investigation which are explained later in my evaluation. (To improve this aspect of the investigation I would try to resolve these inaccuracies)
-
The nearest neighbour analysis was also unreliable due to the fact that one small area of the centre was taken to be representative of the whole centre, when, in fact, this is not the case. (To improve this aspect of the investigation I would try to investigate a much larger area of the shopping centre – if possible, the entire area of the CBD)
The methods used to determine whether pedestrian flow decreases with land value were unreliable for the following reasons:
-
The isoline maps are an unreliable method of testing this hypothesis as they give a very vague impression of the pedestrian flow trends. (To improve this aspect of the investigation I would find a method of presenting the information collected that gave a more precise impression of pedestrian flow trends.)
-
There are many independent factors that could affect pedestrian flow at the times that the investigation took place and therefore the pedestrian count itself was an unreliable method of recording pedestrian flow. (To improve this aspect of the investigation I would try to regulate these independent factors, or at least try to accommodate more for them in the investigation itself.)
The methods used to determine whether the area is busier on market days than on non-market days were unreliable for the following reasons:
-
Only the pedestrian flow at the survey points was surveyed and so the flow at these points only can be represented, and not the flow between each point. (To improve this aspect of the investigation I would increase the number of survey points.)
-
The pedestrian flow was only represented from the times of day that the pedestrian counts took place. Between these times, no data was recorded and so the investigation relies only on information collected at these times. (To improve this aspect of the investigation I would organise more frequent pedestrian count surveys at more regular intervals.)
The methods used to determine the travelling methods due to the origin of each visitor to Bury were unreliable for the following reasons:
-
The investigation did not include visitors that travelled on foot and these may have made up a large proportion of the visitors to Bury. (To improve this aspect of the investigation I would also survey visitors on foot to the area)
-
This part of the investigation did not take into account the fact that public transport may have been too expensive to use very close to Bury’s centre, but if the distance was still too far to walk the visitor may choose to use the car. (To improve this aspect of the investigation I could ask each person if public transport is available from their place of origin and if they chose to use the car over using public transport.)
There were several areas in which the accuracy of my investigation may have been compromised:
The method used to determine whether retail or non-retail outlets dominated the investigated zone, and which category of shops dominated the area, was not very accurate for the following reasons:
-
The map was quite and old base map and so changes had to be made to fit in with the appearances of the premises from ground level. The map itself, therefore, will not have been representative of the actual layout of the premises within the retail zone. (To improve this aspect of the investigation I would try to use a more up-to-date map of the area))
-
There were some shops that fell into two categories and so I had to use my own judgement regarding which category these shops were put into. This meant that this method was not consistent and therefore not reliable. (To improve this aspect of the investigation I would either increase the number of shop categories, or change entirely the method of classifying land useage.)
The methods used to determine whether shops selling comparison goods tend to locate next to each other were unreliable for the following reasons:
-
The method of using the impression gained from the land use survey map to see if several shops in the same category was inaccurate as it relied on inconsistent human perception. (To improve this aspect of the investigation I would not use any method that relied on inconsistent human perception and would try to find a more accurate alternative.)
-
The method used to determine the distance between premises was extremely inaccurate, as the length of a person’s stride was estimated and used as the measuring method. The length of the person’s strides must have varied as they walked between premises and this further compromised the accuracy of this part of the investigation. (To improve this aspect of the investigation I would use a measuring tape or a wheel such as those used for measuring running distances)
-
The calculations of the survey areas were inaccurate as there were awkward shapes that were simplified for ease of working. This may have increased or decreased the actual area. (To improve this aspect of the investigation I would have calculated the area including these awkward shapes, as although it would have taken longer, the result would have been more accurate)
-
The results were rounded, as were the intermediate results at several stages of the calculations, and so the final results were not as accurate as they could have been. (To improve this aspect of the investigation I would not have rounded the results until the very end of the calculations, or not at all)
The methods used to determine whether pedestrian flow decreases with land value were unreliable for the following reasons:
-
The investigation into land value was very inaccurate as the land value at each pedestrian count point was calculated from the value of the nearest shop, not the exact point itself and not the land itself. (To improve this aspect of the investigation I would try to find a way of using the exact land value, which may be accessible from the local council records.)
-
Large numbers of people may have confused the surveyors and therefore the results for the pedestrian count may have been inaccurate. (To improve this aspect of the investigation I could have used more surveyors, or changed the method of recording the numbers of pedestrians, such as only writing down when twenty people passed.)
-
It was impossible to accurately synchronise the timings for the count between survey points and so the survey will not have been conducted at exactly the same time in each place. (To improve this aspect of the investigation I would use accurately synchronised watches)
The methods used to determine whether the area is busier on market days than on non-market days were unreliable for the following reasons:
-
It is difficult to reliably judge which points are nearer the market than others. (To improve this aspect of the investigation I would measure the exact distances)
-
As for the previously mentioned methods, large numbers of people may have confused the surveyors and therefore the results for the pedestrian count may have been inaccurate. (To improve this aspect of the investigation I could have used more surveyors, or changed the method of recording the numbers of pedestrians, such as only writing down when twenty people passed.)
-
It was impossible to accurately synchronise the timings for the count between survey points and so the survey will not have been conducted at exactly the same time in each place. (To improve this aspect of the investigation I would use accurately synchronised watches)
The methods used to determine the travelling methods due to the origin of each visitor to Bury were unreliable for the following reasons:
-
I suspect that many of the people surveyed provided the name of the main road nearest to their house, rather than the actual road they lived on. This will have affected the accuracy of my investigation. (To improve this aspect of the investigation I could try to find a way of getting the exact street name only of where the person lived)
-
At the interchange, the only people present to ask were those who were waiting for a limited number of buses that were about to arrive, or who has just got off a bus. This meant that the people surveyed at the interchange were only those who had come or were going to very similar areas to each other. I therefore did not get an accurate impression of origins. (To improve this aspect of the investigation I could have stayed longer at the interchange, or asked one person from each bus or bus stop. This would have taken far longer, but the results would have been far more accurate)
I do not think that this investigation would be suitable for a covered shopping centre in the CBD of a city, such as The Arndale Centre, as the allowances made for factors found in Bury such as the traditional market and old shopping parade (The Rock) cannot be found in centres such as The Arndale Centre and so the hypothesis of “the area will be busier on market days than on non-market days. Furthermore, it will be the areas closest to the location of the market that will see the highest percentage increase of pedestrians,” would be irrelevant. Furthermore, the hypothesis of, “with increasing distance from the peak land value point, pedestrian flow will decrease,” would be irrelevant because there are very high, similar land values spread around a much larger area in this type of shopping centre.
Similarly, this investigation would not be suitable for a rural-urban fringe development, such as the Pilsworth Industrial Estate, due to the lack of a market and old shopping parade and the fact that these developments are only accessible by car and usually accommodate larger shops such as sofa warehouses. This lack of accessibility would affect the hypothesis, “A person visiting Bury Shopping Centre from nearby will use public transport. A person travelling over a longer distance will use a private car. The tram route will only attract people who live near stops that are close to Bury.” Furthermore, the Metrolink tram route does not reach the Pilsworth industrial estate, and there are significantly fewer public transport routes leading to these rural-urban fringe development sites.
This investigation would also be unsuitable for a smaller, uncovered shopping centre such as the shopping parades in Preswich, where the shops are found along the town’s streets. Shopping in these areas would be severely affected by weather, for example rain would discourage shoppers. The peak land value hypothesis would be irrelevant, as there is no “centre” in these areas and so the calculations needed to prove or disprove this hypothesis could not be carried out. Due to the small number of shops, the hypothesis, “shops selling comparison goods tend to locate next to or close to each other in order to attract custom,” would be very difficult to investigate, as there would not be much variation in the categories of shops available to survey.