Surveying the ward of Brighton called Seven Dials
Geography GCSE Coursework
Introduction
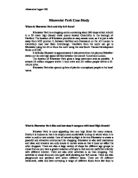
For this piece of coursework, my class and I surveyed the ward of Brighton called Seven Dials. Brighton and Hove is a seaside town on the South Coast of England in the County of Sussex between Ordnance Survey grid squares 30-33 (East-West) and 04-06 (North-South). The railway station is in square 3105. Brighton is mainly a residential town of around 255,000 people with generally a very high housing density. One of the reasons that we decided to investigate Brighton is the fact that it is very accessible from London. This is due to the rail-link between Victoria Station and the central station in Brighton (which is adjacent to the Seven Dials area).
In this project, I will be investigating the process of gentrification. Gentrification is the term used to describe how some inner-city areas, which are often run-down and have large derelict areas, are transformed into fashionable areas for middle/high-class groups. An important thing to remember is that gentrification is not planned, but happens due to changing fashions and market forces.
Gentrification of an area usually occurs with at first a "pioneer group" of lower-income professionals (eg teachers and social workers) moving into an inner-city area to search for cheap Victorian/Edwardian properties to renovate. In Brighton's case, these people will mostly be from London, due to the fast rail-link and because of the relatively low house prices in Brighton compared to London. This pioneer group usually consists of people who are young, have no children and want to be near the city-centre so they are close to their work. The fact that they do not usually have children is important because it means they will not be very worried about the fact that most houses in the Seven Dials area are terraced so they do not usually have back gardens for children to play in. This can be seen on the A3 maps of the Seven Dials area.
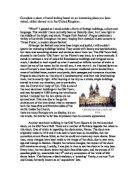
The pioneer group then begins to renovate their houses and the look of the neighbourhood begins to improve. New services then begin to appear to cater for the "pioneers" as a threshold for new businesses can now be achieved. (This means there are enough people for a shop or a service to make an operating profit.) When this happens, the area begins to become quite fashionable and begins to attract people from higher socio-economic groups such as lawyers and people in media and business. Large buildings that used to be derelict are turned into blocks of flats by property developers, which leads to more people moving into the area, which leads to higher-order shops and services (which have higher thresholds) locating in the area. This also increases the rate at which housing is bought and redeveloped. Once there are more well-educated and powerful people in the area they begin to put pressure on the local council to provide better services such as street cleaning, better lighting, more policing and better upkeep of public areas. Once all this has happened, the neighbourhood has been turned into a fashionable residential district, with good services and an improved environment, from a low-income area suffering from depravation. An example of an area of London where gentrification has been "completed" is Notting Hill, and Islington, Clapham and Brixton are areas where gentrification is in progress. There are reasons for areas becoming gentrified; proximity to good transport links, proximity to fashionable areas and areas that have lots of cheap, attractive housing in it. On the other hand, areas close to large council estates with high crime rates and inaccessible areas are unlikely to become gentrified. We can link these factors to the Seven Dials area very easily because it is next to Brighton railway station (with its link to Victoria), it is next to an area of Brighton called Preston, which is very upmarket and fashionable and it does not have many council estates or a high crime rate.
We chose to investigate Seven Dials instead of an area of London, mainly because it is a much more manageable size. This means only twenty people are needed and it will not take much more than a day to cover the whole of it.
Aims
I think that as many people move to Brighton from London, but still keep their jobs in London, it is likely that there will be more gentrification near the railway station. This means that houses are more likely to have been renovated or repainted. Things like new windows and new front doors are also evidence of gentrification. The general building quality will be higher in gentrified areas too. When areas are gentrified, the types of shops and services available change, so we carried out a survey of shops in the North Laine shopping area and I will compare them with records of shops that used to be there. If gentrification has occurred then the shops will probably be higher-order than before, because, as more people move in, shops that need higher thresholds will be able to move in.
I have three questions that I will try and answer with this investigation:
. Why has Seven Dials undergone gentrification?
2. What evidence is there for gentrification?
3. When did gentrification occur here?
Techniques
Method
Sample Size
Study Area
Day/Date
Weather
Own/Group Data
Questionnaire Survey
79
Seven Dials
5/9/01
Sunny
Group
Land Use/Housing Type Survey
04
Seven Dials
5/9/01
Sunny
Group
Environmental/Building Quality Survey
03
Seven Dials
5/9/01
Sunny
Group
Functional Survey
4 roads
North Laine
5/9/01
Cloudy
Group
Kelley's Directories
4 roads
North Laine
Own
House Price Survey
5
Brighton
Own
Own Questionnaire Survey
7
Victoria Station
3/10/01
Rain
Own
We used a number of techniques to collect data for this investigation (listed above) and I shall explain them in this section. We went to Brighton to collect data on 5 September 2001 and when there we did a questionnaire survey, a land use/housing type survey, environmental and building quality surveys and a ...
This is a preview of the whole essay
North Laine
5/9/01
Cloudy
Group
Kelley's Directories
4 roads
North Laine
Own
House Price Survey
5
Brighton
Own
Own Questionnaire Survey
7
Victoria Station
3/10/01
Rain
Own
We used a number of techniques to collect data for this investigation (listed above) and I shall explain them in this section. We went to Brighton to collect data on 5 September 2001 and when there we did a questionnaire survey, a land use/housing type survey, environmental and building quality surveys and a functional survey of shops (this was carried out in the North Laine area of Seven Dials.)
Questionnaire Survey
We gathered 79 questionnaires among us and gathered the data together. A sample questionnaire is shown later in the project. The questionnaire asked people how long ago they moved to the area to try and find out when gentrification occurred in Brighton (one of my aims in my introduction). We asked people where they moved from to see if people really did move from places with expensive housing such as London. We also asked people where they worked. I thought that if they worked in London, they would rate being near the railway station as very important. One question asked people how many adults and children lived in their house. This was asked because most people who help gentrify an area do not have any children and are often not married, so we tried to see if this was the case. The questionnaire asked people to rate what factors influenced their decision to move to the area on a scale of one to five. Before doing the survey I thought that factors like affordable housing and attractive housing would b quite important because of the reasons explained in the introduction, and for being near a park to be less important. The factors are shown on the split bar graph later in the project. Then we asked if their house was privately owned or rented from the council or a private landlord. I thought that there would be a lot of rented housing because Seven Dials is still in a transition phase so it probably still has quite a lot of rented houses. Finally we asked if people had made any physical improvements to the house. I thought that we would find that lots of people had done things like paint their houses and possibly renovate the inside.
Land Use/Housing Type Survey
For the land use and housing type survey, my class of twenty were divided up into five groups of four, each with our own section of Seven Dials to cover so we all had areas of a manageable size. We walked down each of the streets in our area and wrote down the type and age of housing. To work this out, we were all given a sheet with general types of housing such as Edwardian and Victorian with pictures of typical examples of the type in question. We did this because a characteristic of gentrification is that gentrified areas often have Edwardian or Victorian terraces in them, which can be bought cheaply, so we needed to see if Seven Dials followed these characteristics. We also wrote down if there were any shops on the road for the land use survey.
Building Quality Survey
For the building quality survey, we were in the same groups of four that carried out the land use surveys and in the same areas. We carried out this survey to try and see if gentrification occurred nearer the railway station by working on the principle that when an area is gentrified, the building quality increases. We judged whole streets on a system of penalty points as shown in the table below:
None
Little
Some
Much
Deterioration of walls
0
3
5
Paint peeling
0
2
3
Displaced roof material
0
5
9
Broken/boarded up windows
0
3
7
Broken gutters
0
3
7
Structural damage (cracks)
0
3
6
1
Rotting timber
0
2
4
8
Sagging roof
0
2
6
0
We then subtracted the total score of a street from sixty, and made these general observations about the street:
Score
Condition of buildings/street
50-60
Excellent
40-49
Satisfactory
30-39
Generally unsatisfactory
20-29
Very unsatisfactory - action needed
Below 20
Need to demolish or rebuild
Environmental Quality Survey
We carried out the environmental quality survey in the same way that we carried out the building quality survey. We also based it on the use of penalty points and the scoring system is shown below:
Feature
Penalty Points
Maximum Penalty
Landscape Quality
0
4
8
8
Derelict land
0
4
0
0
Litter/vandalism
0
4
8
8
Industrial Premises
0
5
0
0
Traffic Flow
0
3
6
6
Noise
0
2
5
5
Air pollution
0
8
8
Access to public open space
0
3
3
Access to shops and primary school
0
2
5
5
We judged the environmental survey by judging the level of the problem. For example, with landscape quality, if a street generally felt like a nice place to live, perhaps with some trees along the road, we did not give the street any penalty points, however, if a street had badly kept front gardens for example, we gave it four penalty points. If a street did not have any front gardens at all or any trees, we gave it eight penalty points; however we only really gave eight penalty points if a street did not have a nice feel to it as well as having the problems above. After judging a street, we subtracted the points total from sixty to give the street a score.
Functional Survey
Our functional survey was much simpler - we simply picked a few streets in the North Laine shopping district and wrote down all the shops and services situated on them. The roads were North Road, Bond Street, Kensington Gardens and Gardner Street. Later in this project I will compare the types of services on offer nowadays to compare to a few decades ago. (This information is available in Kelley's Directories - we used years 1947 and 1970). This should show that service provision changes as an area gentrifies. I would expect there to be higher order services on offer nowadays compared to in the past.
Housing Price Survey
I did the housing price survey by picking fifteen similar three bedroom terraced houses from a property magazine from an estate agent. Using a map of Brighton I then worked out how far they were from Brighton Railway Station and ranked them on price and again on distance from station. I then carried out a Spearman's Rank calculation on the house. I did this survey because one of the reasons that Seven Dials is gentrifying is the fast rail link to London, so I thought that houses close to the railway station would be more desirable and therefore more expensive. This meant that I was looking for a negative correlation between price and distance from station. The result is later in this project.
Own Questionnaire Survey
I needed to collect some original data for this project and I decided to do this by going to Victoria railway station, where the London-Brighton trains go from, and asking some questionnaires that I devised. A sample questionnaire is shown later in the project, and I hoped to collect about twenty questionnaires in total. However, I only managed to collect seventeen.
I wanted to investigate the process of gentrification in Brighton as a whole rather than just the individual area of Seven Dials. I wanted to find out what reasons people gave for moving to Brighton and why they left the area they did. I thought that many people questioned would have left London so I decided to ask these people which area of London they had left, to try and see if any one factor in particular was persuading people to leave. Hopefully the reasons would tie in with the theory of gentrification explained in the introduction. I included a question that asked people what their job title was to show what sort of people contributed to the process of gentrification. Before doing the survey, due to the factors explained in my introduction, I thought that lots of the people asked would be middle-income professionals like teachers for example. I also tried to collect some more data about when people moved to the area to gain a better idea of when gentrification occurred in Brighton as well as some more data about improvements people have made to their houses.
Data Analysis
I found a number of things from the data that was collected. Firstly I shall look at the data collected in the group questionnaires. One of my three main aims was to try and find out when gentrification occurred in Seven Dials. One of the questionnaire questions asked people how long they had lived in the Seven Dials area for in order to try and answer this question. I compiled all the data into a bar graph with five-year categories. This bar graph is shown below:
As can be seen, almost half the people interviewed moved to Seven Dials within the last five years, and over two-thirds of the people in the last ten years. The number of people moving to Seven Dials is clearly on the increase, which shows that gentrification is an ongoing process and has not stopped. The big increase on the graph is between the 11-15 and the 6-10 categories, which suggests that gentrification only really started within the last ten years, because before that not many people moved to Seven Dials.
Another of my aims was to find why Seven Dials was undergoing gentrification. In the group questionnaires there were questions asking people to rate on a scale of one to five, where five was very important, and one not at all important, how important certain factors were in their decision to move to Seven Dials. I collected the data together and produced this percentage split bar graph:
This graph shows that the four most important reasons that Seven Dials is undergoing gentrification are the fact that its housing is affordable, that the housing is also attractive, its proximity to the railway station and its proximity to the city centre. The attractive and affordable housing are very typical factors of an area that is being gentrified, as explained in the introduction, and proximity to the city centre is likely to be a factor in anyone's decision to move into an inner-city area. I thought that proximity to the railway station would be rated as more important than it was, because I thought that, as many people would be moving from London, easy commuting to London would be very important, but it seems that lots of people are not so worried about that, perhaps because anywhere within Seven Dials is within ten minutes drive to the station. As I expected would be the case, moving to a fashionable area did not rate as very important. This is because Seven Dials is not a particularly fashionable area. This is true as with most areas that are gentrifying because it is only once the area has fully gentrified and that most of the housing has been renovated that an area becomes fashionable. I also thought that being near a school and being near a park would not be very important, which is the case as shown on the graph, because most people who help gentrify areas are either unmarried or do not have any children, so they do not need open spaces for children to play in and do not need to be near a good school. This graph is also good evidence for showing that gentrification is happening in Seven Dials, because it supports the factors influencing gentrification outlined in the introduction.
Another question in the group questionnaire asked people what their job was. I expected that most people asked would be skilled workers with quite a few students considering that Brighton has a large student population. I compiled the data into a pie chart:
The data in the graph supports my predictions, and therefore gives more evidence of gentrification, although I had not expected such a high proportion of unskilled workers. A possible reason for this is given in the limitations section.
To try and find more evidence of gentrification, we asked people if they owned their home or if it was rented from the council or a private landlord. I expected to find that lots of people owned their houses, but also to find that a large proportion of people rented their houses from private landlords. I did not think that many people would rent their houses from the council, because I knew that there are not many council estates in Brighton. I put the data into a pie chart:
This graph shows that over a third of the people questioned rent their houses, which is a characteristic of gentrification because as an area gentrifies, the houses increase in value so some people who can not afford to buy one decide to rent one instead. Another reason for lots of house being rented is because when an area gentrifies, a single house is often divided up into separate flats to maximise the profits for the owner. They do not sell them because they know that they will make more money from renting them.
Again, to try and find some more evidence for why Seven Dials is gentrifying, we asked people where they moved to Brighton from. I collected the data together and displayed it on a map of Great Britain. I thought that there would be clustering around places with high land prices, such as London, because one reason that an area becomes gentrified is because of lower land prices than the places where people already live, as well as the cost of living being lower. This map is shown on the next page.
As can be seen, lots of points do cluster around London and the Southeast, almost certainly to do with the high cost of living in these areas. However, this map is not actually very accurate because I was not able to put a point on for every person that moved from London because there were too many (26 out of the eighty-one people asked to be exact) to be placed all in one relatively small area.
In the questionnaire data that I gathered myself, I asked people whether certain factors influenced their decision to move to Brighton and also whether certain factors influenced their decision to leave their home area. The answers were either yes or no, and I put the data onto two bar graphs:
Factors Influencing People's Decisions to Move to Brighton:
Factors Influencing Decision to Leave Home Area:
The first graph is generally as I expected it to be, with cheaper housing scoring especially highly and friends/relatives not. I did think that the schools category would not be so high, considering that most people who gentrify an area do not have children, but I think this may have been a fluke of the statistics because the sample size was small (see limitations section.) I thought that the lower crime rate category would rate especially highly among people who moved from London, because London has a very high crime rate compared to Brighton. I also expected the good access to London category to be very popular, because all the people in the survey were using the train to go to Brighton, so they would naturally want to be near the station in Brighton. The second graph is also as I would expect it because high crime rate and high cost of living are prevalent in London. However, although the environmental quality of areas of London is not good, I did not expect it to rate highly because I thought that other factors would probably be more important to people without children.
As well as the questionnaires, I also collected some data on house prices in Brighton. I found fifteen examples of three-bedroom terraced houses in Brighton in order to see if there was a negative correlation between house price and distance from the main railway station, thinking that areas nearer the station would be more likely to gentrify, so the land prices would be higher. At first I drew a scattergraph of these two variables, but it was not very clear. I then decided to calculate the Spearman's rank correlation coefficient of the fifteen sets of values and it came out to -0.425. This is a negative correlation, but not very negative. I expected the answer to be something like -0.7, because I thought that distance from the station would have more of an effect on house prices. I think that the problem with investigating this is that it is very hard to find houses that are all equal in attractiveness. Ideally, all houses would be equally attractive, but this was not possible, so it is not particularly accurate. However, despite this, I still think that this gives us an indication that one of the reasons Seven Dials has gentrified is because of the railway station, because if this were not the case, I do not think that that there would be any correlation between the two variables, and the answer to the calculation would have been about zero.
As further evidence for gentrification, I decided to see whether the quality of buildings changed in relation with its proximity to the station. I used the group data collected in Brighton where each street was given a rating out of sixty and drew isolines onto tracing paper, which can be placed over a map of Seven Dials. I also did the same with the environmental quality survey to see if there was any correlation between building quality and environmental quality. This data is shown on the next page.
Looking at the building quality isoline map, however, there does not seem to be generally higher building quality nearer the station. I expected this to be the case, but a possible reason for why this was not so is in the limitations section.
Comparing the two isoline maps, there does seem to be a weak correlation between environmental and building quality, however, I do not think it is strong enough to draw any conclusions from it. I think that environmental quality does not really improve until later in the process of gentrification, because first people redo their houses and only after this start to put pressure on the council for more rubbish collectors etc. Seven Dials is only in the fairly early stages of gentrification, so it is not really likely that there would be a strong correlation between the two factors.
Now I shall examine the results from the functional survey we made in the North Laine shopping district. I compiled all the data I had into a spreadsheet for each of the four roads and then worked out how many buildings on each of the roads for each of the years 1947, 1970 and 2001 was high-order, low-order or if it sold comparison goods. If a building was neither of these I still included it in my survey. I then worked out the percentage for each of these categories and put it in a table.
Gardner Street
947
970
2001
High-Order
32
23
26
Comparison
3
9
39
Low-Order
45
34
30
None
0
34
5
Kensington Gardens
947
970
2001
High-Order
28
30
35
Comparison
5
35
30
Low-Order
35
8
28
None
22
7
7
Bond Street
947
970
2001
High-Order
29
33
27
Comparison
3
1
42
Low-Order
20
1
3
None
38
45
8
North Road
947
970
2001
High-Order
37
30
41
Comparison
0
7
22
Low-Order
26
41
7
None
37
22
30
NB All values are percentages
This data provides a lot of evidence for gentrification because, as explained in the introduction, when gentrification occurs, the types of shops tend to become higher-order with more comparison goods sold. As can be seen from the tables, in nearly all cases, the percentage of high-order and comparison goods shops and services has increased between 1947 and 2001.
Limitations
In this section of my project, I shall look at the problems with some of the techniques that were used, how the results may have been affected, and how they could be improved in future projects.
In my data analysis section, I made a pie chart showing the categories that the people asked in the questionnaires' jobs fell into. I mentioned that there seemed to be more people with unskilled jobs than I expected, but I think that this can be explained by the time of day that we did carried out the questionnaire survey (mid-afternoon.) At this time most of the skilled workers (ie office workers for example) were at work, and not on the streets where we asked people. This meant that we had to resort to going into cafés or shops to ask people the questionnaires, and working behind a bar or in a café are unskilled jobs (in the geographical sense rather than the literal one.) I think this is almost certainly why there were a lot of unskilled workers in the survey. To stop this problem, I think that it would have been better to do the survey on the weekend.
Another unexpected result came in my personal questionnaire survey, when lots of people said that a reason they moved to Brighton was because of schools. I thought that people would not be so worried about this because most people who gentrify an area do not have children, so it seemed strange. However, I think that it was a fluke result because the survey was too small (seventeen people.) However, I do not think that this could have been improved much because it took a very long time to collect such a small number and to collect more would have taken even longer. However, this could explain the strange result. The only way I can think of improving the accuracy of the survey would be to have more people doing questionnaires to increase the size.
To show the building quality in the Seven Dials area, I drew an isoline map for the whole area, expecting the housing to be higher quality the closer it was to the station. However, this was not the case and houses of a higher quality seemed to be fairly evenly spread over the whole Seven Dials area. I think that this was due to a problem with the survey, because each of the five groups would have had a different idea of what constitutes "much deterioration of walls" (see techniques) for example, so one group may have given a street 47 points, and another group would have given the street 53 points. This was shown with Hamilton Street, which was accidentally covered by two groups and was awarded 56 by one group, and 51 by the other. This would not actually affect what category it was in, but it is a good example all the same. I cannot think of a way of stopping any discrepancies in the results without having one group do the whole area, which would have been impractical, as it would take too long.
Peter Kennedy