The aim of my coursework is based on investigating the shopping hierarchy and the C.B.D. (Central Business District) of the Royal Borough of Kingston with the aid of several hypotheses.
GCSE Geography Coursework
http://www.latimerandco.com/area.html
Investigating the shopping hierarchy of Kingston Town Centre
Contents
(pages)
Introduction 3
- My hypotheses 5
- Background 7
Methodology 8
-Secondary information 9
-Primary information 11
-Pedestrian counts 14
-Shops in each street 14
-Problems & Difficulties 15
Data presentation & Interpretation 16
-Figure 1 16
-Figure 2 17
-Figure 3 18
-Figure 4 20
-Figure 5 21
-Figure 6 22
-Figure 7 23
-Figure 8 23
-Figure 9 25
-Figure 10 27
-My Photographs 28
Evaluation 31
Bibliography 32
Introduction
The aim of my coursework is based on investigating the shopping hierarchy and the C.B.D. (Central Business District) of the Royal Borough of Kingston with the aid of several hypotheses. I chose to base my coursework on the Royal Borough of Kingston, mainly focusing on the Kingston town centre, as it is a familiar area that I visit frequently for shopping purposes. The Royal Borough of Kingston covers an area of 3,748 Ha with a population of 147,273 residents. Situated nearby the River Thames and just 12 miles South West of the centre of London, Kingston is well known as the most desirable shopping area for South West London and Surrey as well as being the 17th largest retail centre in the UK.
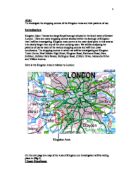
Map of the location of the Royal Borough of Kingston in relation to London.
From http://www.multimap.co.uk
Surrounding areas of Kingston
This shows the location of Kingston and its surrounding towns, many of which may be influenced by the sphere of influence of Kingston.
From http://www.kingston.gov.uk
On the next page is a detailed map of the Kingston town centre.
From a Visitor Guide book of Kingston
My Hypotheses
I have devised seven hypotheses in total to test in this geographical investigation. They are:-
. The central part of the Kingston town centre is the C.B.D of the Royal Borough of Kingston.
I have chosen this as the major hypothesis which I will try to prove with numerous data and information that I am able to get. From the number and quality of shops and services of the town centre and the outskirts of Kingston, and also the comparison of pedestrian counts, I will be able to make a clear comparison of the two areas.
2. Pedestrian count will be higher in the C.B.D and will decrease as you move away from it.
The pedestrian counts take a significant part in the fieldwork, as I do the counts in every street of Kingston in and around the town centre. This will show a clear pattern of how pedestrian counts differ in the area.
3. Pedestrian count will be extremely high in areas of higher shopping quality.
From the results of the data collection, I will be using the pedestrian counts and the list of shops in each street to support this hypothesis. A simple comparison of the information will show the relationship between them.
4. Public transport is concentrated in and around the C.B.D
From 'Kingston Bus Map', you can see the complex arrangement of numerous bus lanes all going into Kingston at one end. Moreover, the results of the questionnaire show that a lot of shoppers in Kingston use public transport, such as the bus and the train.
5. Parking restrictions influence the shopping patterns, especially in the C.B.D.
From the 'Town Centre Parking Map', you can see the restricted number of parking spaces, in comparison to the number of shoppers that visit Kingston during the day. Therefore, it is possible that shopper distribution may be more concentrated around large malls or stores with its own car parks.
6. Location of the chain store influences the number of shoppers that enter each store.
This will be supported by the results of the experimental fieldwork in my data collection. This will be done by counting the number of shoppers that enter a shop in two minutes. In addition, I will do so for a particular shop that has a chain store within the town centre of Kingston. Therefore, I will be able to work out if there really is a difference and the reason for it.
7. Kingston's sphere of influences affects its surrounding towns.
Within the Royal Borough of Kingston, there are many towns such as Kingston, New Malden, Tolworth and so on. During my data collection, I will search for any evidence of Kingston influencing other towns by its popular shopping areas.
Background information
In the past, Kingston was known as the coronation place for Anglo Saxon Kings. Nowadays, around the town centre are over 500 shops packed and crowded to attract 19 million day time shoppers per year and 3.9 million evening visitors per year. (All figures above from 2001 Census, Wikipedia) Kingston is one of the only long-established market towns and has successfully preserved its own special and intriguing feel and impression of a market town. Most of the market squares are surrounded by lines of side streets, filled with a mix of antique and modern shops and stores. The busiest shopping area is the central area of the town centre. There are several large department stores and centres with contemporary retail outlets, colourful and pretty cafes, restaurants and bars. Moreover, the riverside has been developed and re-designed to become an atmospheric area of theatres, performances, exhibitions, restaurants and excellent accommodation.(also residential) Overall, this results in attracting 300,000 visitors to come to the town each week, also making Kingston Town Centre a popular area for shopping and entertainment.
This photograph shows a side of Thames, on the outskirts of Kingston town centre. These areas were decorated like a little village during the development and there are numerous accommodations for visitors to stay.
This photograph shows a cafe also on a side of the Thames on the outskirts of Kingston town centre. These are also an attraction for visitors, who enjoy the view of the riverside.
This is a view of the Wood Street at night. There is a large building with cinema, numerous restaurants, bars and leisure activities such as bowling and casinos. This building especially attracts people in the early evenings and is always very crowded.
http://www.kingston.gov.uk and http://i-hotels.iagora.com
Methodology
I had started the preparations for my coursework several weeks before the data collection; therefore I had plenty of time and opportunity to research for various things and different aspects of the Royal Borough of Kingston. My data collection was done between the 6th and 12th of August, 2007. I collected the data between 11 a.m. and 4 p.m. in order to research in the hours when most pedestrians and shoppers are in Kingston. Most of the shops and stores usually open at around 10.30 a.m. and close around 4.30 p.m., therefore it would be a suitable time. Moreover, I aimed to do the data collection during the weekdays as well as the weekends in order to be less biased and also see the difference between the two. I did not have to avoid weekdays, for students and workers who are not usually shopping during the day, as the data collection was done during a common holiday for everyone.
As I focused my data collection in the Town Centre of the Royal Borough of Kingston, I began from the central C.B.D., gradually moving towards the outskirts of the larger town centre. Various methods used for my data collection were:-
- Collection of secondary data from the internet.
- Collection of secondary data from information centres and the council.
- Questionnaire for pedestrians.
- Photographs
- Field sketches
- Pedestrian counts in each street.
- Gathering list of shops in each street.
- Classifying each shop in three general classes (High, Middle, Low).
- Choose some shops and count no. of shoppers that enter it for close comparison.
- Consider shopper distribution, using pedestrian counts of each street.
- Consider the C.B.D of the Royal Borough of Kingston, with the support of facts such as no. of shops and services in each street.
Secondary data collection
During my Data Collection for this investigation, I have used the advantage of both primary and secondary data. Before I began my fieldwork in Kingston, I researched the subject 'The Royal Borough of Kingston' on the internet and collected information and ...
This is a preview of the whole essay
- Choose some shops and count no. of shoppers that enter it for close comparison.
- Consider shopper distribution, using pedestrian counts of each street.
- Consider the C.B.D of the Royal Borough of Kingston, with the support of facts such as no. of shops and services in each street.
Secondary data collection
During my Data Collection for this investigation, I have used the advantage of both primary and secondary data. Before I began my fieldwork in Kingston, I researched the subject 'The Royal Borough of Kingston' on the internet and collected information and maps from many websites such as 'http://www.kingston.gov.uk' or 'http://www.kingstonfirst.co.uk' (see bibliography for the list of websites and books that I used). I could find several maps about the following things:-
. Kingston town centre/Parking map
2. Location of public toilets
3. Kingston bus map
4. Rail Services
5. Boat Services
6. Surrounding areas of Kingston
- Map 1 shows Kingston town centre with detailed annotations. In every road, popular locations for shopping are named clearly. Areas for off-street and on-street car parking, as well as other areas such as 'no vehicles', were colour-coded clearly with a key on the right side. These annotations and keys helped me a lot throughout my fieldwork, especially in pedestrian counts as I had to do so in every street and I did not know the area fully enough. Also, I could easily use the map for location reference of car parks in my questionnaire to find out which car parks shoppers used. Moreover, map 2 shows location of public toilets in the town centre, which I also referred to in my questionnaire.
- Map 3 is a map of buses to Kingston from surrounding areas, such as Chessington, Surbiton and Croydon. The map is in a spider-diagram shape. There is a convergence of bus routes in the centre; there are many fewer bus routes near the edges of the map. Therefore, this supports my hypothesis 4 that public transport is concentrated around the C.B.D. Each route is colour-coded clearly with a key to show the name of the bus; moreover there is a destination finder, showing an A-Z list of surrounding towns around Kingston. This evidently shows that Kingston has a complex public transport system, indicating the crowdedness in the Kingston town centre. Furthermore, map 4 shows another public transport system that people use to go to Kingston.
- Map 6, showing areas surrounding Kingston, was very useful for my fieldwork. In the first question of my questionnaire, there is a list of towns near Kingston, which I referenced from map 6. The map shows a general, bold division of the outlines of large towns with the Royal Borough of Kingston on the South side of the Thames. Each town is annotated clearly, and there are seventeen towns in total. By using this map, I could see from which direction and areas most people came to Kingston for shopping. Moreover, by referencing names from this map, I could research in the internet locations of complex shopping areas similar to Kingston.
On the first day of my data collection in Kingston town centre, I visited the Kingston council to get any leaflets or brochures about Kingston. There I found four useful leaflets related to my investigation.
. "Discover Kingston". This two-sided leaflet contained of information about every useful aspects of Kingston. Starting from shopping, entertainment and restaurants/cafes, there were others such as leisure/recreational services, banking, financial services, hotels and so on. Out of all these endlessly useful information, I found the map most useful, as it was animated and 3D to show every detail even more clearly.
2. "Kingston's bus stations". This leaflet, exactly the same as map 3 mentioned above, showed a large map of every bus route that reached Kingston.
3. "Visitor Guide". This guide booklet contained 53 pages of information about every shops and services in Kingston. I have used a few pictures of areas in the town centre from this booklet. Most importantly, all the information that overlaps with other leaflets was much more detailed; addresses and telephone numbers were convenient, as I used them to find rare shops.
4. "Kingston town centre area action plan" consisted of information mostly about the future development of the Kingston town centre. However, it also had information about the history of Kingston town centre as a popular area for diverse aspects of people's interest. For example, a map showing a lot of areas turning into vehicle-restricted areas shows the crowdedness of shoppers. The market place in Kingston town centre is a vehicle restricted area as the street markets and shoppers over-crowd the place between the two lines of shops and stores on each side. This is closely related and supports the hypothesis 5, as an area of shops, stores and markets is positively influenced by the restriction of vehicles.
On the next page is the Kingston town centre parking map mentioned above.
http://www.kingston.gov.uk
Kingston town centre parking map
Primary data collection
Questionnaire
My questionnaire is on the whole a series of questions which will allow me to get the public opinion of the shopping area in general. I have decided to ask my questionnaire to forty pedestrians in the Kingston town centre, as it is the minimum number of participants needed for a statistically viable sample. The most significant information I needed from the answers were whether the interviewers were whether if they were satisfied enough and thought that Kingston town centre was a superb shopping area, or they felt that the area lacked some qualities to be a fantastic shopping area. The primary data I received from the questionnaires will take a large part in my investigation of the shopping hierarchy in Kingston, but also support my hypothesis 1 that the central area of Kingston town centre is the C.B.D. of the Royal Borough of Kingston.
List of questions and explanations
) Where do you live?
Croydon Ealing Elmbridge Epson&Ewell Hammersmith Hounslow Kensington & Chelsea Kingston Lambeth Merton Mole Valley Richmond Southwark Sutton Other
In the first question I have named every town in the area surrounding/near Kingston Upon Thames, and also put 'Other' for people who have travelled far although it is very unlikely. By naming the most likely towns they are going to write as an answer, it is more convenient as it becomes much easier and quicker for the interviewer to circle the name(rather than writing it). The answers from this question will enable me to work out the position of Kingston in a sphere of influence amongst the surrounding towns, therefore supporting hypothesis 6.
2) How did you travel here?
Car Bus Train On foot Motorcycle Bicycle Other methods
The second question asks which method of transport the interviewer used to travel to Kingston. Again, I have written down various methods that the interviewer most likely used. Moreover, the answers of this question will support the hypothesis 4, as a large number of interviewers used various public transport.
3) How long was the journey? [ If long, what do you think is the reason why you come so far for shopping? ]
<10 11~20 21~30 >30 (Minutes)
Often the interviewers live in Kingston Upon Thames, therefore majority of answers would be <10 minutes. However, if the interviewer has come from another town nearby, the answers may go up to >30 minutes. This will show the variety of distances people can afford to travel to get access to Kingston town centre. Also, you can assume that the sphere of influence of Kingston spreads that much far away from the centre. This will give a little support to the hypothesis 6.
4) How would you rate the ease and accessibility of the transport system here?
Convenience 1 2 3 4 5
Cost 1 2 3 4 5
From 1 to 5, the interviewer can rate how convenient the transport system is for them. Therefore, I will be able to have a range of public opinions of the transport system in the Kingston town centre. This may become related to the hypothesis 4 later on. The shorter time you take to arrive in Kingston, the closer you live to Kingston town centre; therefore you are near the crowded area of Kingston.
5) How often do you come here?
Daily 3(or more) times a week 2 times a week 1 time a week once a fortnight once a month first visit
For the fifth question, I have a list of how often the interviewer comes to Kingston town centre. The most likely answer is the several at the beginning, as majority of the interviewers were residential, but I have given a range of answers. This may have a slight effect on hypothesis 3. The more often they come, the more people there will be on that particular day in Kingston town centre.
6) How long do you stay when you come here?
All day 1/2 a day 3 or more hours 1 hour <1 hour
The answer to the sixth question may have a slight effect on the pedestrian counts that I did in the streets. The longer a person stays in the Kingston town centre, the more crowded the area will be for that amount of time. Therefore, the answers to this question may be related to hypothesis 3.
7) What do you usually buy in Kingston?
Clothing/Shoes
Accessories
Food
Furnishing/Households
Other
Please specify names of three shops that you visit most frequently
___________________ ___________________ ___________________
By categorising the variety of things the interviewer is able to buy in Kingston town centre, you can generalise the majority of things that people buy. Therefore, this question will take a major part in supporting hypothesis 1.
8) How much are you aiming to spend here today?
£0~25 £26~50 £51~75 £76~100 >£100
Again, I have categorised the amount of money the interviewers would spend in Kingston town centre. By categorising vaguely, I have avoided provoking the interviewer's privacy. Also, the answers will give a general idea of how much is spent by 40 people in the Kingston town centre in a day. This may also relate to hypothesis 1 later on.
9) Can you buy everything that you want in Kingston?
Yes / No
This question simply asks for the key information we need for the section of public opinion. The answers of this question will have a great impact on hypothesis 6. If the answer is 'No', this has a negative effect on the sphere of influence, reducing the size of the sphere of influence.
0) How would you rate Kingston town centre as a shopping area?
Cost 1 2 3 4 5
Convenience 1 2 3 4 5
Variety of goods 1 2 3 4 5
This question takes a major part in the investigation of Kinston town centre as a shopping area. This gives us a feedback from the shoppers how they rate the cost and variety of goods as well as the convenience of the shopping area. For example, a survey shows that the Bentall centre, one of the main shopping areas of Kingston town centre, is visited for two main reasons - convenience 31% and Good atmosphere / clean / tidy / spacious 29% (Figures from the Bentall student pack)
1) Where else do you go for shopping?
_ _ _ _ _ _ _ _ _ _ _ _ _ _ _ _ _ _ _ _ _ _ for...
Clothes/Shoes
Accessories
Food
Furnishing/Households
Other
The answers to this are simply just related to hypothesis 6, as some answers of this question may suggest that Kingston town centre lacks and is not getting the satisfaction of the shoppers; this will also affect the size of the sphere of influence.
Are you...?
Male ? 0~9 ? 10~19 ? 20~29 ? 30~39 ?
Female ? 40~49 ? 50~59 ? 60~69 ? 70+ ?
Lastly, I have not begun the questionnaire with the usual gender and age, as they seem to provoke the privacy of the interviewers very slightly; and put them off answering the rest of the questions. As I had originally decided to have only 10 questions in my questionnaire, I have added this as additional information.
Thank you very much for your time and help. Have a great day!
I have concluded my questionnaire with a light comment and a smiling face to thank the interviewer for filling in my questionnaire!!
Photographs
Majority of the photographs I have included in my coursework were personally taken. However, there are a few of areas that I didn't take a photograph of, and are from some leaflets that I collected from the Kingston council. The photographs show the completely packed streets in the centre of the town centre. This will support my hypothesis 1, along with endless streets of busy shops in the background. On the other hand, there are some photographs of quieter streets, where there aren't many pedestrians or shops around. This clear contrast will take an important part in supporting hypothesis 2 and also hypothesis 3.
Pedestrian counts
Street name
Day
Time
Condition
0~9
0
(weather)
0~19
5
20~29
46
30~39
51
40~49
8
50~59
5
60+
0
Total
45
My pedestrian count was to count how many pedestrians walked past in front of me in a street for a known period of time. I have done pedestrian counts on every street in the Kingston town centre, as I worked in a spiral way, starting from the centre. I counted for 5 minutes in each street. In a particularly busy street such as Clarence Street, I had to take the readings from two sections of the street and take an average to make the result fairer. Moreover, I have divided my pedestrian count into age groups as it would be helpful to record how many of which particular age group was seen at the location. The figures of pedestrian counts will be related closely to hypothesis 2 and hypothesis 3 later on. Pedestrian counts are very useful as they were done separately for each street, so I am able to arrange shopper distribution and concentration with this information. Also, the pedestrian counts can be compared with the quality and the number of shops there are in each street.
Shops in each street
Carrying on with the subject above, I have done various things with the shops in each street. After making a random list of them in data collection, I have given each shop points/scores. High = 3
Middle = 2
Low = 1
The higher the scores of each street, the higher quality of shops there are in those streets. This is generally unrelated to the popularity of the shops, but it may be influenced by the price of items in the shop and the size of the actual shop. For example, John Lewis scores 3 with the great advantage of being a five storage building and also being the largest single store in the Kingston town centre. After I have classified all the shops in the Kingston town centre, I can then compare those results with other factors such as pedestrian counts or the majority of that particular pedestrian count in a street.
Furthermore, I have done some further work on comparison of shops that are classified as the same level. Although John Lewis and Marks and Spencer may both score 3, they are very different in many ways. For example, the price of items or the most popular age group may be different. Therefore, I have done a few comparisons of similar shops to give a clearer idea of their order in the shopping hierarchy of Kingston town centre. The comparison was done by a counting how many people enter the shop through a particular entry in two minutes. The counting was done in similar times of the day, as to be even fairer.
Problems and difficulties
I faced quite a few difficulties during the data collection, mostly because I was working individually at the time. Primarily, the Kingston town centre was too large (in area) for me to research thoroughly. Further problems will be mentioned in the Evaluation.
Data Presentation and Interpretation
Figure 1
This pie chart displays where the 40 participants of the questionnaire live. As you can see the majority 25/40 of people are resident in Kingston, near the town centre. However, there were several people, who came from further places such as Worcester Park and Tolworth. Through my experience, it is relatively convenient to take the bus to visit Kingston, as almost all buses in the Royal Borough of Kingston go through Kingston town centre. The variety of towns in the pie chart supports my hypothesis 6, as it proves that Kingston's sphere of influence is affecting those towns.
Figure 2
On the next page is a pictogram showing the ratio of methods of travel that 40 shoppers use to reach Kingston. The first column on the left shows the key of images I am going to use to represent each methods of travel. The results show that :-
Car 21
Bus 12
Train 2
On Foot 5
Bicycle 0
Other 0
Although majority of the shoppers were residential in Kingston, it is seen more convenient to drive into the town centre, rather than walk. This is probably because of the size of the shopping area leads to further travel distance from residential areas. Moreover, the majority of drivers suggest the convenience of driving to Kingston, therefore the convenience of availability of several car parks and spaces in/around the Kingston town centre. Therefore, this relates to my hypothesis 5.
Figure 3
Above is a scatter graph showing the relationship between how often shoppers visit Kingston and how long they usually stay there. The key :-
1 Daily All day
2 3 or more times a week 1/2 a day
3 2 times a week 3 or more hours
4 Once a week 1 hour
5 Once a fortnight <1 hour
6 Once a month
As the majority of both how often and how long scored 29 and 18, we can assume that most of those shoppers could have a job in the Kingston town centre. Not only is Kingston town centre attractive for shopping, but the number of services, job availabilities, labour needed...etc that follows it also attracts people towards it. Although over 60% of the questionnaire participants were residential in the area, we can assume that there were at least a few that were not residential and was a part of the majority of daily, all day visitors. This supports my hypothesis 1, that the Kingston town centre is the Central Business District of the Royal Borough of Kingston.
Figure 4
This is a bi-polar graph showing the overall aspects of Kingston as a shopping area. In my questionnaire, there were several questions that gave the participants a chance to rate each aspect from 1 to 5 (5 being the best). The cost for goods scored 4.075, with 13 and 17 out of 40 people competing scores of 4 and 5.
This shows that goods in Kingston town centre are between relatively cheap and affordable for the shoppers that answered my questionnaire. However, it could also mean that the goods are cheap only in the shops that these 40 participants visit frequently. There are many high-order shops, majority of middle-order shops and also numerous low-order shops in Kingston. Therefore, this result shows that Kingston is a suitable shopping area for the shoppers, whichever order of shops they visit.
The convenience of the shopping area scored 4.25, with 24 out of 40 scoring 5 points. The satisfaction level is very high as Kingston is developing and modifying many factors. For example, some of the busiest areas such as Eden Walk are potential redevelopment sites as well as improved pedestrian links. Others are already primary shopping areas, and there are many primary shopping area extensions that are yet developing. Gateway improvements as well as new public spaces and new bus stations are only a minor part of what the Kingston council is proposing to do in the future. (Information from the Kingston town centre Area Action Plan leaflet) All this results in even more increase in the satisfaction of the convenience of the shopping area for shoppers and therefore emphasizes my hypothesis 1.
The variety of goods in Kingston town centre scored 4.8, with 24 out of 40 scoring 5 points. The satisfaction level is the highest here as Kingston has over 300 shops that I could find along with the Bentall centre which I have not included. This shows why the participants of my questionnaire were most satisfied. In addition, the result of this bi-polar supports my hypothesis 1, as the high figure often suggests a Central Business District.
The convenience of the transport system scored 4.125, with 25 out of 40 scoring 5. As mentioned several times earlier, almost every bus in the Royal Borough of Kingston goes through the Kingston town centre. Also, there is a train station on Wood Street, which is located very near the centre. Most importantly, there are numerous off-street and on-street car parks in and around the Kingston town centre. Some examples may be Cattle Market, Fairfields, Ashdown Road, Eden Walk, Bentall Centre and so on. As I found out from my survey that the majority of shoppers travel by car, it is obviously related to the fact that the transport system is very convenient. This supports my hypothesis 4 in every way.
The cost of the transport scored the lowest, 3.150, with the majority of 14 people scoring 3 points. For the matter of public transport, there are exceptions of children under 16 and the senile. However, the rest and also the cost of parking cars may be more costly than the shoppers' expectations. This may relate to my hypothesis 4.
Figure 5
This is a Choropleth map of how I have divided Kingston Town centre into zones 1,2 and 3. Considering the pedestrian counts and the scores of high/middle/low -order shops in each street, I have made a relatively accurate division between each zone. The comparison of pedestrian counts relates to hypotheses 2 and 3, where a definite decrease in figures can be seen, excluding some anomalies. A few areas with high figures stand out, such as Clarence Street, Eden Walk and Eden Street, and all three are located in zone 1.
Bi-polar graph
Choropleth map
Figure 6
This is a compound bar chart showing a comparison between the pedestrian counts and the scores of shops in streets of Zone 1. The street with both highest pedestrian count and scores of shops is Clarence Street. Because the street is fairly always hectic with numerous different types of shops and hundreds of people going through at the same time, I have taken two counts in order to get a more precise comparison. The other roads are all in zone 1, very near each other.
Pedestrian Count
In comparison to zone 2, mostly between 60~130, and zone 3, 0~90, zone 1 has a range of 130~330. This definitely proves my hypothesis 2 and 3 correct, as pedestrian counts decrease as you move towards the outskirts and also the peak points are situated in the busiest shopping areas.
Scores of shops
I gave 3 points for high-order shops, 2 points for middle-order shops, and 1 point for low-order shops. As I made a record of names of shops in each street, I classified each of them depending on the atmosphere of the shop, average price of goods sold, the popularity of the shop, and so on. Again, Clarence Street has scored the highest point of 84 in zone 1, and evidently the highest in the whole Kingston town centre area. This supports my hypothesis 1, showing clear evidence that the Central Business District of Kingston is the Kingston town centre.
Figure 7
Figure 8
Above figure 7 and 8 show a similar pattern to figure 6, but in a smaller scale.
In zone 2, there seems to be an unusually high count of 122 in Fairfield North Street in comparison to other streets between 60 and 90. This can be explained because of the Cattle Market Bus stop located on the edge of Fairfield North Street, near the shopping area of Kingston town centre. Therefore, a lot of buses stop here to guide visitors into the shopping area. (See My Photographs of Cattle Market Bus stop) Moreover, the scores of shops here are generally low, between 0~30. This is because there weren't as many shops in zone 2 and also because most of the high-order shops are concentrated in zone 1 for more attraction of shoppers. This also supports my hypothesis 1.
In zone 3, there also seems to be an unusually high count of 82, whereas other streets are all below 50. This can also be explained as Fairfield Road is the entrance to the closest residential area of Kingston shopping area. There are three roads, Fairfield East, Caversham Road and Minerva Road branching off on the inside, so there are quite a lot of residents who pass Fairfield Road. Otherwise, figure 8 fits in exactly with the decreasing pattern of zone 1,2 and 3 therefore, supporting my hypothesis 2 and 1.
Figure 9
This compound bar chart shows the comparison of different age groups in Pedestrian counts in each of the three zones. The graph shows that zone 1 is always higher than any other zones, except in one occasion, when it is the same as zone 2 at 49 people in the age group 60+ Also, zone 2's pedestrian counts are never lower than zone 3's, which helps to follow the straightforward, decreasing stairs pattern. This proves that my hypothesis 3 is evidently correct.
Figure 10
This is a drawing of circles, of which its radius is directly proportional to each street's pedestrian counts. I divided the pedestrian counts into 50, and used its 1 significant figure to draw the circle. The middle point of the street was measured with a ruler and then the circles were drawn as accurately as possible using a compass. The circles are also colour-coded. Red for zone 1, Orange for zone 2 and Green for zone 3. This shows the little sphere of influences of the shops in each street and the largest can be seen, again, as Clarence Street, Eden Walk and Eden Street. This again shows and emphasizes my hypothesis 3, as those three streets radiate the three largest circles in the whole shopping area. Also, my hypothesis 2 is re-emphasized as sizes of the circles get smaller as you go further from the centre.
Directly proportional circles
Evaluation
During my data collection, I constantly felt that there was too much data to collect, organize, analyze and interpret. I think that I have focused on getting information so much in depth and also in detail that I didn't think of the variety of data that was available.
Moreover, as mentioned briefly in my Methodology, I have had several problems during the data collection. As this is an individual project, I had to carry out the data collection individually, whereas I had been in groups of several people in my previous investigations. The hardest and most time-consuming part of my data collection was the pedestrian counts along with recording names of shops in each street. In each street I waited and recorded people as a tally chart, 5 minutes for busy ones and 10 for quieter ones. Most of the streets, except for a few, were too hectic for me to get accurate counts of which age group that they belonged to; it was impossible for me to categorize and record the sex of each person at the same time. In addition, the number of days required for a day of pedestrian counts increased as I realized I had to do them only in the busy hours of Kingston. For example, shops usually open at around 10:30 am and close at around 5:00 pm. Therefore, I have to use those hours to collect the data in order to make the data more reliable and fair.
There are numerous problems related to the questionnaire, as there is always the risk of the shoppers feeling uneasy or disturbed by what they think is "too personal" I put careful consideration into choosing the participants of my questionnaire, in order to reduce the possibility of being rejected. However, there were still some people, who found the questions, such as 'Where do you live?' or questions related to their sex and age, invading their privacy. Furthermore the questionnaire was composed of eleven questions and an extra one at the bottom in order to gain as much detail about Kingston as a shopping area from just 40 participants. As a result, people may have felt overwhelmed by the length of the questionnaire even before they began to write anything down.
On the other hand, I do believe that the data I have actually collected are very accurate. I have put careful consideration into the details of collecting the data, such as where, when and how. So, if I had a chance to re-do my data collection, I would allow myself more time and focus on getting a wider variety of information for later use in data presentation. For example, I could have investigated another shopping area, such as Tolworth, Surbiton and NewMalden for comparison in order to gain more fulfilling and conclusive results. Although those towns mentioned are in a smaller scale, they will increase the reliability of the data I collect, as I will be using the exact same method in order to make this a fair comparison.
Nonetheless, my hypotheses have been closely related to what the results show from my data collection. Hypotheses 2 and 3, relating to the pedestrian counts has been proved right by the comparison of results of pedestrian counts. The compound bar charts, figures 6, 7, and 8, shows that the pedestrian counts definitely decrease as you go towards the outskirts from the centre. Also, the peak points such as Clarence Street and Eden Street support hypothesis 3 further. Results from the survey of buses and transport system shows that hypothesis 4 is definitely true, as well as the results from the questionnaire which indicate majority of public transport users use the buses to get to Kingston.
On the other hand, I did not collect enough data to prove or disprove hypothesis 5. If I had researched and tried to find some more information about the parking and restrictions in Kingston, I could have supported this hypothesis. However, the shopping distributions show that highly popular areas for shopping are vehicle-restricted areas for convenience of shoppers.
Furthermore, hypothesis 6 was supported by variety of results from the questionnaire. As well as shoppers visiting from faraway towns such as Worcester, majority of shoppers were more than satisfied with shopping in Kingston. This indicates that people do come to Kingston for purely shopping purposes as they have a preference for the area. Therefore, this clearly proves the hypothesis.
Although I was not quite satisfied with how I concluded the investigation, I think that I have done a lot of research into shopping in Kingston town centre; and I was able to identify important factors that affect shopping in Kingston. If I were to repeat this investigation, I would plan the methodology and rearrange my hypotheses to be more suitable to the contents.
Bibliography
http://www.latimerandco.com/area.html
http://www.multimap.co.uk
http://www.kingston.gov.uk
http://i-hotels.iagora.com
Visitor Guide book of Kingston
Ellie (Na Kyeong) Lee Upper 5 Geography Coursework