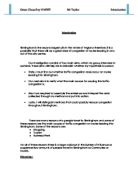
Vans/mbs start off quite similarly, with the amount of vans/mbs starting off quite low and gradually increasing. The same pattern is shows with the buses. Lorries start off quite high but keep decreasing as the day goes on. Bicycles stay low constantly through the day.
This graph shows the traffic going into Birmingham City Centre using Broad Street. Cars are the main vehicles going into Broad Street. We can see this due to the fact that cars have the highest amount of vehicles by looking at the graph. Lorries and bicycles however, have the lowest amount.
During the early hours of the day the number of cars starts off quite high with the rush hour being at about 8:00 AM. As the day goes on it starts to decrease. However at around 12:00 PM there is a sudden increase of traffic going into Birmingham City Centre. This may be due to the fact it’s around lunch time. At around 13:00 PM, there is a decline in the amount of traffic going in. Then it begins to rise for an hour up until 14:00 PM, when it starts to decrease again. From 14:00 PM till 17:00 PM the traffic going in carries on decreasing.
Buses and vans/mbs stay relatively close together in terms of the amount of each that appears to be going into Broad Street. However, buses show the same type of pattern that cars show. During 8:00AM till 9:00PM the amount of buses is quite high. This is quite similar with the vans/mbs. There is a sudden increase at 13:00PM. However Lorries and bicycles always stay low through the day.
This graph shows the passenger car units (PCU) coming into Broad street. PCU stands for passenger car unit. This metric is used to measure the traffic-flow rate on a road such as Broad Street. The graph above is probably the most vital evidence that helps solve my hypothesis. This graph would give me a clear idea of whether Broad Street (a main route into the city) was congested. Using the Government figures the saturation point for a road such as Broad Street is 1522. This meant that when a value was over this, the road was congested. The graph shows that Broad Street was congested throughout the day. At 9:00 AM it’s at its highest (2780), this is peak time in other words. From 11:00 AM onwards, the figures always stayed above 2000 but stayed below 2500. I can say that Broad Street on that day was congested at all times.