Land Use Survey – For the Swindon land use survey my group covered Regent Street. We drew a map on graph paper and used 1 square as the size of one normal hop frontage to try and keep it to scale. I recorded the height by using one square as one storey, and recorded the function by using abbreviations such as R for retail, O for offices, etc. and created a key. Other groups surveyed the other three streets and then when we were back in class the data was collected from the other groups for all four streets so that a universal map of the C.B.D. could be made, which was then used by everybody. Unfortunately this map did not show the height of the buildings, only what use they were put to. When I came to do the Faringdon Land Use Survey, I drew the map for the entire C.B.D. by myself, as Faringdon’s C.B.D. is much smaller. I drew it on graph paper, and included the height of the buildings as well as the use, to try and get the most accurate map of the C.B.D. I then drew up a neat version when I got back home.
Environmental Quality Survey – In Swindon, my group did our environmental quality survey in regent street and then shared the data once we were back in class to get the data for the other streets. We divided Regent Street into five equally spaced locations, starting with location 1 at the centre where all four streets meet, and location 5 at the far end. In Faringdon I divided the entire C.B.D. into five locations, because it was considerably smaller than Swindon, and Faringdon’s C.B.D. isn't really big enough to show much variation. Location 1 was in Church Street, Location 2 was in London Street, Location 3 in the Market Place, Location 4 in Marlborough Road, and Location 5 in Gloucester Street .At each location I gave a score out of 3 for Litter, Pavements and Roads, Noise, Building Maintenance, Plants and Traffic, based upon the following criteria:
Sphere of Influence Questionnaire – I used the same questionnaire for both towns. I asked 15 people from each town the following 5 questions
- Where have you travelled from today?
- How did you travel here today? (tick boxes: Car, Bus, Walk, Train, Other)
- What are the reasons for your visit? (tick boxes: Food, Clothes, Luxury Goods, Money Advice, Other Services, Work, Other Reason)
- Which other towns do you shop at?
- What items do you buy there?
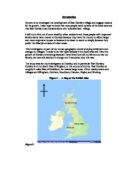
I presented the results to question 1 on a sphere of influence map. This is basically a map of the area showing towns and villages up to about 50 miles away, from Bristol to Oxford. On this map I drew one line per person from the places that the people came from to Swindon. For the people that I asked that came from Swindon, I drew a circle around the town with a radius of one millimetre per person that came from Swindon. I did the same for the people I questioned in Faringdon, but with Faringdon at the centre instead of Swindon. The results to the other questions I did not present, but they provide useful background information.
Pedestrian Counts – At each of the five points in Swindon I stood and counted the pedestrians as they passed me on my left hand side for two minutes and then on my right hand side for another two minutes, and then added this together to get a total for each location. I then swapped the data back in class to get results for the other three streets in Swindon. In Faringdon I also counted each side for two minutes and then added them together to get a total for each location. In both towns I counted children and babies as pedestrians, but cyclists as traffic. I presented the Swindon data as a line graph, with one line for each street, as it progressed from the centre outwards. For the Faringdon data I could not produce a line graph because the locations were not in any order. Instead, I produced a bar graph to compare the amount of pedestrians at each location.
Analysis
Environmental Quality Survey
As you can see from my graphs, Faringdon’s environmental quality is about the same throughout the C.B.D. except at location number 1, in Church Street. Traffic played a major factor in determining the E.Q. in Faringdon, because the roads and traffic affected the not only the Traffic score, but also the Noise and Pavements and Roads Scores. At location 1, there was little traffic, as it is not a by popular road, as are present by the other locations. Less traffic at location 1 meant that there was less road noise, which was the main source of noise in Faringdon. The roads were in better condition at location 1, presumably because there is less traffic that would cause damage.
Throughout the rest of Faringdon, the environmental quality is fairly consistent. Location 4 scored lowest of all, because I gave it no points for plants. This did not make too much difference because other locations didn’t gain many points on this factor, and the scores for all the other factors were similar as at locations 2, 3, and 5.
Faringdon’s environmental quality is fairly equal throughout the C.B.D. because it is really too small to show much variation between locations. This is because as the C.B.D. is quite small, any attempts to improve the environmental quality have taken place over the entire area, raising the quality equally. Pavements and roads are regularly cleaned, though unlike Swindon, they are old and repairs have been carried out over the years creating a mix of surfaces. Building Maintenance and Litter scores showed little variation throughout the C.B.D. because care is taken to preserve Faringdon’s image as an attractive, historical rural town. Faringdon’s total E.Q. was 59.
In Swindon, the environmental quality was partially dependent upon the function of the shops at each location. The entire C.B.D in Swindon is pedestrianised, so there is no variation on this factor throughout the area, as each location scored 3 points.
Regent Street had the highest E.Q. in Swindon, and was higher than that of Faringdon. In Regent Street, the environmental quality was equal at locations 1 & 2, as the different factors scored the same amount of points at each place. This is because they are nearer to the centre where all four streets meet, and this area was renovated and had improvements made all at the same time. The improvements stretched as far a point 2 in Regent Street, so they both achieved the same E.Q. At locations 3, all of the factors scored the same as at points 1 & 2 except the score for Plants. This was considerably higher, because of the introduction of trees. The final three locations were all equal in total, but lower building maintenance was recorded at both. This was probably because the buildings here used by smaller shops that have less money to spend on maintaining the look of their buildings. There was the best score for plants here, as there were trees and flowerbeds, all introduced by the council to improve this area. There was little litter along the entire street, possibly because it is cleaned regularly by the council. The total E.Q. for Regent Street was 76
Canal walk had a low environmental quality at location 1 because the noise here was very bad, and there were no plants. The renovations and improvements that the council made to the centre area did not include plants, and noise was one thing that they could not control. Other than this, the E.Q. was reasonable. The buildings were reasonably well maintained and tidy, and the pavements were excellent, because when improvements were made, the entire area was paved in an attractive pattern. The location was unfortunately very noisy though, so it scored no points for this. Location 2 was better because there were small trees there, but that was the only difference, so the location scored that much better than the previous. Location 3 had fewer plants, but it was less noisy so it achieved the same score as location 2. Location 4 was less noisy still, possibly because it is surrounded by the large buildings, which could block the sound. Location 5 was as quiet as location 3, and scored the same total E.Q. The buildings were poorly maintained, and this would have brought the total down, but the plants scored full points as there is a grassy area with trees and bushes. Litter remained at two points throughout the street. The total E.Q. for Canal Walk was 60
Bridge Street had the lowest environmental quality at some locations. It was also the shortest street. This could mean that there was less space to show much variation. At location 1 it was very noisy, so it scored no points for litter. This was the same at locations 2 and 3. There was a tree at location 1, so it did well for plants. There were no plants at location 2, so its total was that much less than location 1. For the other three locations, there were flowerbeds and one tree, so they scored 2 points each for plants. Building maintenance and noise were the two main factors that caused Bridge Street’s environmental quality to be so low. At point 2 and point 3, building maintenance was very low, with only 1 point at each location. It was very noisy all along Bridge Street, locations 1, 2 & 3 scoring 0 points, location 4 only scoring 1 point and 3 points for location 5. As you can see from my graph, Bridge Street’s E.Q. was highest at location 5. This could be because it joins on to two lesser shopping streets, and improvements have been made to that area to try to attract more business. The total E.Q. for Bridge Street was 55.
The Parade scored very low on litter. At some locations, it was so bad that no points were given at all. This could be because of a lack of bins, or because the area had not been cleaned recently before the survey took place. Had the locations not been so littered, the street would probably scored as high as Regent Street. The buildings were well maintained throughout the parade, and though some were old, they had been kept neat and tidy. There were few plants in The Parade, but there are a few trees about half way down, and these show up on the E.Q. graph around points 2, 3 and 4. The Parade also fared well on the amounts of noise. All the locations scored at least 1 point, and location 4 scored all 3. This made up for the zero points it got for the amount of litter present. The Parade’s total E.Q. was 58.
Pedestrian Count
In Faringdon, you can see on my graph that London Street and the Market Place are the two places with the most pedestrians. The least pedestrians were found in Gloucester Street, closely followed by Church Street. Marlborough Street was in the middle, and then at the top, with the most pedestrians was London Street, with the Market Place just below. I was expecting to see the Market Place with the most pedestrians, but I was surprised to see it beaten by London Street. The Market Place did have a large amount of pedestrians in it, probably because it links all four streets that make up the C.B.D. together, and the most shops. I think London Street may have had so many pedestrians because it leads to other streets where a many people live, and there is pedestrian access to roads at the back of the shops and to the car park. There were fewest pedestrians in Gloucester Street because there are the least amount of shops and services found there. Marlborough Street had a fairly high number of pedestrians because it is home to Budgens, one of Faringdon’s largest shops. Church Street had few pedestrians because there are hardly any shops or services there, and because it doesn’t really lead anywhere other than housing. The total number of pedestrians counted was 73.
The Swindon pedestrian count shows that in most streets the number of pedestrians declines as you get further from the centre. This could be because the biggest, most popular and well established shops can afford to group together near the centre, so that their customers don’t have to walk so far, and are therefore more likely to enter the shop.
In Regent Street however, the pedestrian count actually rises towards the far end, and the total at location 5 is actually higher than the total at location 1. The count for Regent Street is the highest, and it goes down at first, thin rises between locations 2 and 4, the goes down again at the end. It is the highest because it is the main shopping street, and the longest. One reason that the pedestrian count rises at point 4 could be that it is a good way for pedestrians to access the C.B.D. because it is the nearest to the most housing, roads and other shops.
The Parade had the second highest pedestrian count, starting at location 1 with the same number of pedestrians as Canal Walk, and then first going up at location 2, and then down towards the far end. I expected that there would be fewer pedestrians towards the end of the street, as it is further from the centre where the favourite shops are. There could be a number of reasons for the count to go up at location 2. It could be because there was a certain shop there that was very popular, or, as it was nearing lunchtime, it could have been because there was a café or shop selling food.
The pedestrian count in Canal Walk dropped steeply to begin with then fell less rapidly towards the end. The initial big drop was probably because many pedestrians walked through the Brunel Centre, a large indoor shopping mall with one entrance in Regent Street, and two in Canal Walk. The numbers of pedestrians would have then dropped because there would be fewer, less popular shops further away from the centre.
Bridge Street had so few pedestrians that the decline in pedestrian was hardly noticeable. This is because the main use of Bridge Street is at night, as it is mainly consists of pubs, bars and restaurants, and these get less business during normal shopping hours. Another reason why the pedestrian count did not drop very steeply could be that many the pedestrians could have been passing through to get to shops on the other streets that Bridge Street leads to.
Sphere of Influence Questionnaire
I presented the results of my sphere of influence questionnaires on two large maps of the area. From the Sphere of Influence Map for the Faringdon survey you can see that you can see that most of the people who I questioned in Faringdon came from either Faringdon itself, or the surrounding local villages. The circle around Faringdon shows how many people came from Faringdon itself, and each millimetre in the radius represents one person. Just over half of the people I questioned in Faringdon came from Faringdon, and had travelled by walking, cycling or by car. Most of the people that came from the surrounding villages had travelled by car or by bus.
As you can see from the map of Swindon’s Sphere of Influence, people were prepared to travel much further distances to visit Swindon. The same as in Faringdon, about half of the people I questioned had travelled from elsewhere, and about half came from the Swindon. In Swindon, people had travelled long distances from towns such as Abingdon, Cirencester and Devizes, but they had also travelled from local villages. This shows that Swindon’s sphere of influence is greater than that of Faringdon.
My questionnaire showed that most of the people asked in Swindon were there to buy luxury goods or clothes, and that most of the people in Faringdon were there to buy food. Assuming that the greater the population, the more services and shops available in a town, this shows that people are only prepared to travel long distances for some items, such as luxury goods or clothes. There is a cut-off point at which people will decide to go to a larger town with more services than a smaller, closer town that may offer less choice. This cut-off point between two towns can be estimated using Reilly's law of retail gravitation. We can apply Reilly’s law, also known as breakpoint theory, to find the cut-off point at which people would travel to Swindon instead of Faringdon. To do this I will take Faringdon's population to be 7,000 and Swindon's population to be 180,100 (both rounded to nearest hundred from 2001 census data) then the distance between them as 12 miles. This would mean that, using Reilly’s law, the cut off point between Faringdon and Swindon is approximately 2 miles from Faringdon. This means that if you lived 1.8 miles from Faringdon, and more than 10.2 miles from Swindon, you are more likely to go to Faringdon to shop, but if you live 9.6 miles from Swindon, and more then 2.4 miles from Faringdon, you are more likely to choose Swindon to shop at. Therefore, Faringdon’s sphere of influence for retail is 2 miles.
Christaller’s theory also supports this, because it says that if for expensive, infrequent purchases or services you would fall within the sphere of influence of a larger, distant town, but for more frequent, cheaper purchases or services you would fall within the sphere of a smaller, closer town or village. The large town in the middle (ie. Swindon) has a very large sphere of influence and attracts smaller towns and villages from around it. Around the outside of the large town are smaller towns each with their own spheres of influences attracting the surrounding villages. Each of these villages has a mini sphere of influence. These spheres of influence combine so that if someone in a small village wants a newspaper, they will go to their village shop in the sphere of influence of that village. If they want to do their grocery shopping they will probably fall into the sphere of influence of a small town, and will be prepared to travel slightly further. If they want to buy a car or television, they will fall into the sphere of influence of the large town where bigger and possibly better shops are, and are prepared to travel the longer distance for expensive items.
Land Use Survey
I have presented the land use surveys for the two towns on two maps of the C.B.D.’s. From these we can see that the main land use in Faringdon’s C.B.D. is split between housing and low order retail. Gloucester Street consists mainly of housing, but there are a few services nearer the Market Place. Marlborough Street is a mixture of housing, retail, services, offices and public buildings. London Street is about half housing and half retail, with most of the retail at the end closest to the Market Place. Church Street was all housing except for the church, which came under public buildings, and took up most of one side. The Market Place was the only place to have no housing, and it was instead a mixture of retail, entertainment, services and public buildings.
In Swindon, as we can see from the map, the central business district is almost completely made up of retail. The Parade consists only of retail, and Regent Street is mainly retail, with the exception of four services and one entertainment building. Canal walk has only three buildings used for services, and two finance buildings. The rest are all retail. Bridge Street is the only street to have more other buildings than buildings used for retail. It has seven finance buildings, and seven entertainment buildings. Swindon's C.B.D. is a good example of how shops of the same type, such as retail, group together. Bridge Street is where the entertainment and finance companies group, and The Parade, Regent Street and Canal walk are where most retail is found.