Central locations were chosen because there were likely to be more people here due to the services they offered, e.g. shops, pubs, banks, etc. Central areas are always the most built up in a settlement because they are the most easily accessible and usually have been the basis for the settlement, e.g. London, the small site near the river that was chosen by the Romans because of its physical features that made it easy to live in, is now the CBD for a large, sprawling metropolis. Due to the increased number of people that were expected to be found here, and therefore results that could be obtained more quickly and with more efficiency, central areas were chosen.
Here is an example of the traffic flow survey that was used in each of the three areas to collect data with:
Method Two: Questionnaire
This method was use to prove or disprove two of the hypotheses. These were the first and third hypotheses, the first stating that there would be the smallest threshold in Aldborough, increasingly followed by Aylsham and London, and the third stating that the Sphere of Influence will increase in size from Aldborough, Aylsham and London
This method was used because it was the best way of obtaining the information that was required to prove or disprove the hypotheses. It was also the most convenient and easiest way of getting the data, and therefore was used.
This data was collected by someone standing in different places inside the specific settlement area that was being studied, and asking people the questions written on the questionnaire. As the person did this, they recorded the data on the sheet in the spaces provided. This makes the data primary data.
Other data collection techniques could have been used, but these were impractical, time consuming and unreliable methods. For example, had someone followed people home to determine where they lived, not only is it likely to be illegal, but it would also be time consuming and impractical.
Again, there were some disadvantages and limitations when using this method. The weather in Aylsham, where it was hailing whilst the data was being collected, again affected the results we got, as people were less likely to want to stand outside in such weather. This also may have put them in a negative frame of mind, therefore unfairly influencing the way the people answered the questions, therefore making the results slightly biased and possibly unreliable.
There were also flaws in the questionnaire itself, especially in the final question. This particular question “Do you intend to come here in the future?” seemed a little pointless, as it was expected that everyone would return to the area. The results of this question were therefore surplus, and, as was expected, everyone that was questioned in any of the three chosen areas of research said yes to this question in my studies. The results to this particular question also did not answer, prove or disprove either of the two hypotheses it was supporting.
Specific questions were asked generally to prove or disprove the hypothesis. The questions were adapted so that the answers they gave would prove or disprove both the hypothesis that this method was answering. For example, the question “How far have you travelled to come here?” was ideally suited to proving or disproving the third hypothesis: “The sphere of influence will increase in size from Aldborough, Aylsham and London.”
It was also quite difficult to find fifteen people to question in the small village of Aldborough, and so this particular exercise was done as a group exercise. This was because there were too few people for each group to question individually, and those who could be found would have to be repeatedly asked by five or six people. Had this occurred, this again would have influenced the results we got, as the people who were being questioned became more and more frustrated, and would have given negative answers, again affecting our results.
Here, central locations were again used due to the larger number of people that would be attracted to the area because of the services and facilities it offered. If there were more people to ask, the results could be gathered with more speed. However, to obtain results which showed the whole picture, one could have collected data at different points in each settlement, at different times of year, day, week, etc.
The central locations were the same as those that were used in the traffic flow survey, outside Tally Ho Discount in North Finchley, the Market Square of Aylsham, and along one of the main roads in Aldborough. However, with the questionnaire, there was more movement than there had been with the Traffic Flow survey. One had to move towards people rather than standing still and expecting people to go to them, as the traffic flow data had been collected by one standing in the same spot and counting the vehicles. This movement may have made the results a little unreliable as some of the people who were questioned were asked outside of the directly central market square, possibly down a side road or in a small corner shop, etc.
Here is an example of the questionnaire sheet we used to collect data with:
Method Three: Land Use Survey
This method was used to prove or disprove the following hypothesis:
“There will be a greater amount of and variety of shops in London, followed by Aylsham, followed by Aldborough”
This method was used as it was thought to be the one most suited to the task of proving or disproving the above hypothesis. It was thought to be suitable as it displays the shops or buildings in a particular area, and can be made very specific if a detailed key is used. This therefore allows one to be very specific about the shops one sees in an area, which gives an accurate, clear picture of the services, shops and goods one could find in that area. This answers the hypothesis perfectly, and so was thought to be the right choice for proving or disproving the statement.
This method was taken by one person sketching a rough map of the area whilst we were physically in the settlement, and labelling all the shops and buildings in that area. This drawing was then copied up once we got indoors and coloured in neatly according to the key. This makes the data primary data, as one standing physically in the field and physically collecting the data obtained it.
Other methods could have been used, though these would not have been as accurate as the land use survey. Examples of these methods include phoning up the customer care services of major stores, and asking whether there were any such stores in any of the three settlement areas, though this would have been restricted to one type of shop (the large department or chain stores) as the smaller business’ found in these areas are unlikely to have a large enough of a demand for a customer service for there to be one. Therefore, this is an impractical and time-consuming method to use.
There were very few limitations to this method. However, the main problem was one of inaccuracy, as if the land use survey had been drawn wrong, we had incorrect data. Also if the area that was being drawn was large and there were many side streets, it was very difficult to record it accurately.
The data here was again collected at the same central locations, so as to keep a constant, and therefore fair, element to the results. The whole of Aldborough was used, as Aldborough was small enough for this. However, only the market square of Aylsham, where the results for all other surveys had been collected was used, although the entire stretch of North Finchley High Road was copied down.
The central locations were used because they contained most shops and services in a small area of the settlement, which would therefore help prove or disprove the hypothesis: “There will be a greater amount of and variety of shops in London, followed by Aylsham, followed by Aldborough”
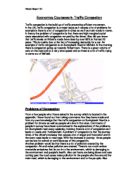
Method Four: Graffiti and Vandalism Survey
The above method was used as a means of proving or disproving the seventh and final hypotheses. The hypothesis was:
“ There will be a decreasing amount of graffiti and vandalism from London to Aylsham to Aldborough.”
This method was used because it was very obviously and directly linked to the task, specifically designed to answer such a hypothesis. This is indicated in the name given to the method (“Graffiti and Vandalism Survey”), and also in the way in which the survey is taken. It was therefore thought to be the method most suited to the task of proving or disproving this particular hypothesis.
A member of the group collects the data for this method as a primary source.
Someone observing the area around him or her collected this data. There were two main sections on the method used, one for graffiti and the other for vandalism. Within these sections, there were categories listed, such as broken benches, smashed windows and broken signposts in the graffiti section, and the size of words, with categories for their size in cm, in the vandalism section. The person who was collecting the results then had to tick the box in the place which applied to their physical observations. This was repeated three times, in three different places in the same settlement.
There were limitations with this method, as was indicated by the results we got. When there was little or nothing physically scarring the area, the results were simply non-existent as there was nothing to record.
However, the results for Aldborough did still prove that it was the cleanest and most graffiti/vandalism free area that we studied. This therefore made the data collection technique a success, as it proved or disproved the hypothesis.
The data was collected at three locations in each of the three settlements that were observed. In order to collect a large range, and therefore a larger picture, of results, three random and very distanced locations were chosen. In each settlement, one of these locations was in an area of the central location examined in each of the other surveys. The other two locations were selected at random, but were along the outskirts of the settlements. This offered a wider and broader picture of the area, and results are displayed as figures 21 and 22 in line graph and pie chart form.
Here is an example of the graffiti and vandalism survey that was used in the field to collect the data:
5. Annotated Photographs
This method was used to prove or disprove the following hypothesis:
“The quality of houses will become better from Aldborough to Aylsham to London.”
This method was used because it appeared the only method that could offer results which had any relevance to the hypothesis. Therefore, it was opted that this was the method that was to be used. Other methods, such as hand drawn sketches or post cards, would also have bee acceptable, though photographs were a more practical and accurate method of storing this data.
In order to determine the house quality, pictures were taken of random houses that seemed typical to the area, for example, in aldborough there seemed to be mainly bungalows and small cottages, so these were mainly taken pictures of. These were generally taken individually, making them Primary Data.
There were several limitations that arose due to inefficient planning and poor foresight. As a result of these factors, the first opportunity that was given to take photographs of housing in Aylsham was overlooked and forgotten, and therefore the entire group had to return to Aylsham in order for the correct data to be collected. Due to the lack of time this divert would cause, only one member of each group in need of information was allowed to go and collect it.
However, this limitation was not the fault of the data collection method itself. Within the method itself, there were few limitations, apart from the fact that the number of pictures in the film restricts the number of pictures one could take.
The photographs were taken again mainly in central locations, but also down side roads and as different examples of housing in the larger settlements. Aldborough itself was too small to contain housing in the side roads, and contained mainly only one type of housing. With the other two settlements, there was a great more variety of housing styles, and therefore more pictures were needed to supply the information in sufficient detail.
The photographs were taken in these locations to show the different types of housing in the three areas, and also to see if either the Concentric Zone or the Sector Theory could be proved correct. The Concentric Zone Theory turned out to be closest to the settlement patterns, as the houses closest to the CBD did turn out to be those of lowest quality (Zone 3).
6. Environmental Survey
This method was used to prove or disprove the sixth hypothesis:
“Aldborough will be cleaner than Aylsham, decreasingly followed by London.”
This method was used because it was relevant to the hypothesis, and would clearly prove or disprove it. It was also used because it was the least time consuming and most convenient method available.
The survey was done as a Primary source of data. Five different locations within each settlement were selected at random, and ten aspects of the different locations were observed. These aspects, such as litter and air pollution, helped to determine how clean the area was. Depending on the quality of the site, each aspect of the survey was graded out of 5 for the individual site. 5 was the highest number of points each site could get, and 1 was the lowest.
Few limitations were offered by this survey, as it was well suited to the task of answering this specific hypothesis. However, when the five different locations were very close to one another, as in Aldborough where the area was not large enough to get sufficient distance between the locations, the results became very similar. In Aldborough itself, five locations were not necessary, when three could have displayed the same pattern with less inconvenience.
I doubt that there was a more suitable method that could have been used to answer this hypothesis, as the environmental survey fully answered the hypothesis.
The data was collected at three locations in each of the three settlements that were observed. In order to collect a large range, and therefore a larger picture, of results, three random and very distanced locations were chosen. In each settlement, one of these locations was in an area of the central location examined in each of the other surveys. The other two locations were selected at random, but were along the outskirts of the settlements. This offered a wider and broader picture of the area, and results are displayed as figures 1, 2 and 3 in radar diagram form.
Here is an example of the Environmental Survey that was used collecting data in the field: