Methodology
In this methodology I will be explaining what I am going to do to try and prove my hypothesis. My hypothesis is that the high pedestrian density of Covent Garden proves that it is in the CBD. My primary pieces of data will be statistics, pictures, pedestrian count and a look at the land uses. I will now represent this in a table:
Pedestrian count- I will use this method as this would give me a clear and direct picture if my hypothesis is correct. On my field trip to Covent Garden I will count the amount of people who walked past me in 1 minute and 35 seconds on the 15 main roads of Covent Garden and asses the results which I will place in my conclusion. I will also support this count with pictures from the internet.
Pictures- Are a great way to prove my hypothesis and support my pedestrian count but these pictures would be secondary data from the internet. Pictures are vital to provide evidence for the overall investigation.
Statistics- these will show the official numbers for what the place is used as so we can draw a conclusion from it to support my hypothesis. For example if there is many commercial shops were the percentage of these outlets is the highest it will prove my hypothesis as they need a high pedestrian density to sustain all these retail outlets. This will be collected from the internet or a library.
A look at land uses- this will help as if there is a lot of entertainment and retail outlets there must be a lot of pedestrians as that’s who they are catering for. You couldn’t have a high amount of retail and entertainment units outside the CBD with minimal pedestrians as you’ll shut down. This will be done by recording the outlets what they are and looking at the statistics to combine primary and secondary data to provide accurate feedback in which we can draw a conclusion.
Questionnaire- this is a vital as we can obtain primary statistical values by counting the amount of people who answered yes or no to my personally made questions. We will ask a certain number of men and women from different cultures to eliminate bias which will give us a reliable questionnaire in which to work.
Conclusion (results of field trip)
This is where I will showcase all the data I collected on my research trip to Covent Garden.
Questionnaire Statistics- this is interpreted from my questionnaire which was collected from the people in Covent Garden. The questionnaire was asked to 20 females and 20 males to evict any bias.
When asked how people made their way to and from Covent Garden 5/40 people said they cycled, 6/40 walked, 6/40 commuted from out of London to Covent Garden but the vast majority used public transport from within London 23/40. The thing that is most interesting is that out of 40 people not one person used private transport such as car, we can conclude that most people are using public transport within London and are avoiding using cars as there are no parking spaces and may be congested.
25 out of 40 people questioned said they used the restaurants and bars situated in Covent Garden the 15 people who said no was normally because they said it was too expensive or they had no time to sit and stop. Most of the 25 people who do use them were going there after work or the tourists using the entertainment in Covent Garden.
19 of the 40 questioned said they do use the retail stores; these were normally the people who are in Covent Garden for shopping or are tourists. The people in Covent Garden for work are the people who make up the majority of the people who said they don’t use the retail stores.
29 out of 40 people said the evening rush hour is the busiest suggesting that everyone is out using the Covent Garden entertainment and the workers are all coming out to go home but 10/40 also said that the lunch rush hour is the busiest which is a considerable amount. Combined with the information that 37 out of 40 people said on a scale of 1 to 5 Covent Garden was rated 3 and 4- 3 people also suggested it was a 5 telling us that the evening must be a very congested time in terms of traffic and pedestrian densities.
Looking at our statistics from our questionnaire this tells us that that the high pedestrian densities are due too the entertainment facilities such as street acts, restaurants and bars and theatre. There is also a massive workforce of financial workers, business men and employees for the things like entertainment, retail stores and cleaners. This high amount of both types of people creates a hotspot for high densities of people which is backed up by my pedestrian count of different streets in Covent Garden.
OFFICIAL STATISTICS- the population is currently between 6,000 and 6,500 people. There are 102 Bars and Public Houses, 127 Restaurants, 127 Sandwich Bars and Cafés, 21 Theatres, 12 Hotels & Conference Centres, 11 Clubs, 11 Off-licences, and 1 Cinema in Covent Garden. The high number of entertainment facilities means there must be a high pedestrian density as they would have no business if there weren’t- more evidence that Covent Garden is characterised by high pedestrian densities.
PEDESTRIAN COUNT- this is where I look at if Covent Garden has a high pedestrian density by studying the results of my pedestrian count. These two charts below represent the information from Covent Garden which was taken by the amount of people who walked past me in 1 minute and 35 seconds.
As you can see there is a high pedestrian density on each street with high numbers of counted people as that was the amount in only 1 minute and 30 seconds. This shows Covent Garden to be in the CBD. If you compare these results of the pedestrian count with other places in the CBD such as Victoria it is very similar with only the land uses changing slightly.
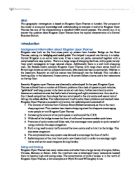
Pictures:
As you see in the right picture there is an extremely high amount of pedestrians which is indicating it is at a peak time such as lunchtime or evening. This is photographic evidence of a high pedestrian density supporting my hypothesis but also shows Covent Garden to have a largely commercial land use giving further evidence for my hypothesis. There is not more than 1 meter between each person creating a high pedestrian density.
Land uses:
Covent Garden land use:
Total amount of places is 194.
This pie chart represents the information above in the table. It shows us that there is a high amount of retail stores, further evidence of my hypothesis as if there wasn’t a high pedestrian density their would be no customers for all those retail stores. Also the high amount of restaurants and café’s also suggests a high pedestrian density and is a characteristic of the CBD in itself. In looking at the land uses it seems that café’s and restaurants are unevenly scattered throughout Covent Garden but retail shops are often adjacent or opposite to each other which says there are many of them.
Looking at Statistics, pictures, the amount of pedestrians, land uses and the results of the questionnaire I have tested and concluded they all match to known parts of the London CBD and is the evidence to support my hypothesis ‘Covent Garden is characterised by high pedestrian densities’. You can compare Covent Garden with confirmed places of the CBD and notice that they have many similarities in all of the above that characterise a CBD and these are all reasons for the high pedestrian densities in which Covent Garden is characterized.