Background to the Study Area
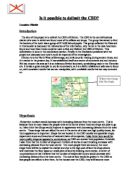
The location of Guildford is in southeast of England, situated half way between London and the south coast, where Portsmouth Harbour is. It was a Saxon town in the 6th century and by the 12th century; it had already become a market town with a Norman castle, serving the local area.
Hypothesis Statements
Guildford’s physical features have played a big part in this. If we look at a map of Guildford carefully, we’d notice that river wey runs straight through it and that there are hills nearby. This meant fuels were available in the pass (Timber from woodlands) for building. People were also able to hunt animals for food or grow crops on nearby fertile land. People can drink or fish from the river wey, therefore people started to locate near the river, especially when a canal and a railway was built by 1845. Later when railway was more developed, Guilford became a commuter town for London and also a lot of surrounding towns.
Guildford proximity influence many large industrial firms to locate there, many of these located the river wey because it provide waterpower (generated electricity) for the factories. It also made transportation of goods easier and much cheaper.
Today Guildford has grown to become one of the busiest towns in the U.K; it’s proximity to Heathrow airport also makes it more accessible to the wider world.
Guildford is mainly a middle class town, there isn’t a high degree of unemployment and the crime rates are low. There are only one main council housing area (Park Barn) and therefore reflects the average income in the area (i.e. every one can afford a proper accommodation –majority)
Shopping centre (i.e. the friary), modern Hospital (i.e. Royal Surrey) and many other shops and services have increase in Guildford, due to more demand by the increasing population around Guildford.
Science parks, business parks and University Towns have grown around Guildford, mainly on Greenfield sites. The majority have been attracted by the relatively low cost of land, pleasant working environment and also the low density of buildings. Guildford’s pleasant environment and its wide range of shops and services continue to attract both residents and tourists.
Structure of the Text
Each of the following chapters has been designed to fulfil different functions. Chapter two explains the methodology of the study, and shows the way in which each type of data was collected during fieldwork. Furthermore, this section explains which hypothesis the data refers to, and how it will finally be presented. Chapter three is devoted to this presentation, containing tables, maps, graphs and diagrams based on the data. Chapter four analyses this data, commenting on each graph and map in terms of the original hypothesis outlined above in the introduction. The study is evaluated in Chapter Five, and each reference used is given in full in the bibliography.
Data Collection
Method
Land-use survey
To classify the land-use I Guildford, our class was divided into three groups, each covering 1/6 of the town centre. (Because we just have three groups, so we just use the first three part of the town centre)
We did this by going round with our goad maps and putting each building into the most appropriate category. We put them onto the goad maps as letters.
Department Store (D)
Chain Store (Ch)
Convenience (Cn)
Public building (P)
Estate Agent (E)
Financial (F)
Other Services (S)
Residential (R)
Vacant (V)
Independent Retail (I)
We want to classify the land-use in Guildford because we want to identify any grouping of particular activity in areas. This would give us some ideas about the characteristics of Guildford’s town centre.
This also helps us to find out whether the CBD can be delimited (i.e. can we draw a line to the edge of the CBD, where its ends) when (R) – residential starts to come in amongst the shops (commercial) we would see roughly the boundary between residential and commercial and hopefully might see a boundary around the CBD.
Front Footage/Rateable Value
The other things we did were the pedestrian count and the front footage of the shops. Both of these were also done in groups. Each group was responsible for measuring the front footage of two shops. This was simply done by pacing out the width of the shop front; each pace is estimated to be 3 feet, this tells us roughly the total width of the shop front. The rateable value of each shop was given to us (as secondary data) we divide this by the front footage. This tell us the rate index (i.e. how much in pound per metre of the front footage is)
This is a useful piece of data because it will allow us to compare the different shops as. We cannot compare the rateable values unless some account is taken of the size of the premises. (This is because the rateable value is mainly determined by the size of the premises and how close it is to the CBD) This data will indicate where the centre of the CBD is as land value falls as we move further way form the CBD. We should also find that the rate index should fall as we move out of CBD because land value drops towards the edge of the CBD where there’s little competition. The pedestrian counts were done right outside the shops that we measured the front footage of and because each group was responsible for two shops. To do this, we arranged it so that one person counted the number of people moving from left to right and another person counting the people moving from right to left.
We needed to do this because we wanted to find out where the busiest part of the town is. From my knowledge, I know that the pedestrian flow will be greatest in the centre of the CBD because land value is the highest here (competition is greatest); this mean only the big shop (usually chain store) selling comparison goods could afford the high rents. These usually attract a lot of people. Most roads and railways also tend to focus in the CBD, bringing people into the town centre from all of the outer zones.
Building Height
I also recorded building heights, especially the multi-storey buildings; this is a useful piece of information because it indicates where the centre of the CBD is as a vertical zoning is a response to the high land values of the area, this will also help us decide where the boundary between the commercial and residential will lie if there should be one.
Data presentation
The spearman’s Rank Correlation coefficient gives strength of the relationship. To calculate the value of the spearman’s Rank correlation coefficient. My table tells you how to work out the Rs.
Analysis
Guildford, I can see more clearly how the shops and services spread across the town centre. I’ve colour the chain store, Department store and other services in bright colours because they indicate where the CBD is, as I know most of the most common land-use in the CBD will be commercial. I tried to use contracting colours for residential, convenience and vacant buildings as these indicate where the edge of the CBD is.
From our map, we can see that the buildings are nucleated in a linear pattern and from the arrangement of the settlements; this pattern seems to fade as we move away from the centre of the map. If we look at the area at the top of the map, we can see that the buildings are not as uniformed as the ones closer to the centre of the map.
I don’t think this town centre is circular in shape because the settlements are built side by side in a linear pattern, which spreads across the map.
It is very obvious that the land-use is mostly commercial, with an abundance of shop, services, offices and an absence of residential, convenience and open space.
From our land-use map, we can see that shops and services are not completely random and that there seems to be some specialization in the certain areas. The most obvious group is the chain stores. These seem to duster together right in the centre of the left hand side of the map below. We can see literally a whole row of chain stores on the high street just near the bottom of the map and this seems to spread upwards towards the friary (the big shopping centre which is outlined) although we do find there are a few chain stores further along the high street on the right.
I think the town centre is this shape perhaps because the shops and services have all tried to locate along the high streets. From our map, we can see very clearly that the shops all run along the in a row, packed together and there is a high density of shops especially between North Street and High Street in the centre of the map.
This town centre might have an abundance of chain stores and a lack of convenience and residential because of the bid rent.
We know that the land value is the highest in the centre of the CBD and therefore only the big companies can afford the highest rents I think this might be is one of the reasons why there is an absences of convenience and residential because the land value falls as we move away from the CBD, as space is least available in the CBD, which means a lots of competition over small area of land. Therefore we tend to find convenience and residential away from the CBD where land value is lower. For example a corner shop isn’t exactly going to be able to afford the same rent as Mark and Spencer.
The chain stores are usually very big companies; these companies can afford high rents and going to want to locate in the busiest area where the pedestrian flow is high because they usually run a big business that requires a lot of customers.
I think this is why all the chain stores are clustered together. An abundance of a particular type of shop some items makes life much easier for people who have travelled there to buy comparison good because people compare them. This offers them more choice and saves them from walking long distances. This also to Estate Agents; I think when people want to buy something expensive like a house, they’re going to want to be able to compare them so that they get better ideas of what they really want. I personally don’t think an estate agent in the middle of no where would appeal to me if I was thinking about buying a house, I think I would rather go somewhere which has an abundance of estate agents because it usually makes you think that they are professional and promising. On the map, these are located at two ends on the high street relatively near to banks (one reason is that people might want to draw money out for deposits.)
I think the chain stores have located where they are because of the high pedestrian flow it offers or average a mortgage. This area of clustered chain stores is possibly the CBD.
Evaluation
I produced a land-use map, which classified the types of shops into 10 different categories. This allowed me to spot any particular grouping of activities and also answered my aim, that the most common land-use in Guildford is commercial. I felt that this map was quite difficult to work with because it doesn’t cover a wide enough area, and shows very few non-commercial buildings, such as the residential areas. Instead, the map concentrates on the centre of the town, and fails to take in much of the outside areas, such as the Victorian terraces or Industrial parks. This is because the goad map we were given was mainly based on the CBD of Guildford and does not allow for sufficient comparison with non-CBD areas.
I think we could have looked at environmental quality of the town, i.e. how pleasant the area is, because this does affect how popular a town might be, as we all like to shop in nice clean areas, especially elderly people who would often like to see some trees planted in urban areas.
I think our method was inadequate because we didn’t cover a wide enough area to show where the none-commercial activities come in around the town, we needed to look further out as we can’t come up with a conclusion by looking at one source of data only, we needed to collect other data to support our ideas.
I produced two isoline maps. One was the pedestrian flow map and the other was the land-values map. The pedestrian flow map showed the isolines very clearly and showed a decrease away from the central part of Guildford. I was generally quite pleased with it, and it was very easy to understand. Although I felt more figures were needed because there were no figures for some of the large areas of land (areas between isolines)
The pattern shown on the land-value map was quite different to the pattern of the pedestrian flow map, there weren’t continuous isolines but lines were all over the map, which seemed very complicated at first but as I looked more closely, similarities were found. I think the method was inadequate in someway even though it generally shows that where the land-values are high, the pedestrian flows would be high. The fact that we only divided the rateable value by the front footage instead of the whole area of the shop was inaccurate, because some shops may have a big front footage but a very small area if they don’t go back very far, therefore our data would be more accurate if we actually knew what the area of the shops were. We must also bare in mind that land values are influenced by many factors and not just accessibility. I think more figures were also needed in order to make the map more accurate and reliable.
Most land-use in the CBD will be commercial
Most sites are coloured in red on my land-use map, which represents chain store. The settlements coloured in yellow, which represents other services are scattered across the map. These are the most common types of land-use in Guildford, which are both commercial. We can see that there is an abundance of chain stores; this on its own has exceeded all the non-commercial sites in number (i.e. residential, public building, convenience) not including the other services, which are also counted as commercial.
Map to show the boundary of the CBD
I need to decide where the boundary of the CBD lies by looking at all of my data. I.e. the isoline maps, graphs and also the land-use map.
I think it is actually quite difficult to draw a line from my 2 isoline maps because they are quite different. The isoline map showing the pedestrian counts shows very clearly that the peak value is at the west end of Guildford, mainly around the buildings in between the High Street and the North Street, where most chain stores are. (Shown on my land-use map)
The isoline map of the land values also shows that the peak values are within this area. It definitely conforms to the pedestrian flow map that the west end of Guildford has the highest land-values; the peak value towards the west end of Guildford stretches further out than the other peak point towards the North-east of Guildford. In my analysis of the scatter graph, I mentioned that the furniture shop along North Street for some reason has got a relatively high land value compared to the shops in that area, therefore the peak towards the west end of Guildford is more reliable.
By comparing my land-use map, pedestrian flow map and land-value map, I can see that there is definitely a boundary around the block of chain stores towards the west of Guildford. The high pedestrian counts; high land values and commercial activities (mainly chain stores) are all characteristics of a central Business District.
Therefore my conclusion is that the line that conforms to all the statements I have made on the pedestrian flow map will be the boundary of Guildford’s CBD.
The 150 forms the isoline pedestrian flow map includes both peak values on both isoline maps towards the west end of Guildford but unfortunately, it doesn’t include the peak point towards North-east of Guildford shown on the land value map, and also some chain stores that are towards the North end of Guildford.
I do realise that I can use the geographer method to delimit the CBD, by taking the value of 40% of the PVI (peak value intersection) but I’m not going to use exactly the same method as some say it should be 40% whiles others argue that it should be 15 %. Even town or cities are very different therefore I felt that I should delimit the CBD of Guildford logically by look at my primary data.
Land-use models
The following are exiting land-use models. I’m going to explain each of them and different ideas behind them.
All towns and cities are different, Guildford is a unique town and it’s land-values and land –use are both definitely different to any other in the world because the layout of them can only be similar but never the same.
Geographers have realised the similarities between the structure of towns and cities, therefore they have developed a number of simple models to describe the pattern they’re found.
- Burgess
Burgess, who studied Chicago and produced this simple diagram, developed this particular model. It was found that the city was made up of a series of concentric rings or zone s around the city centre. The model suggests that buildings are older towards the centre and the width of the zones suggested the density of the buildings. This diagram mainly suggest that the city has grown outwards equally in all directions.
- Hoyt
This is a sector model shows the development of zones along major transport routes or physical features such as rivers. Unlike Burgess, this model shows that particular types of land-use could be found in different zones, the layout is not as uniform as Burgess because it is trying to show that certain kinds of activities are more developed than others, and that a particular type of land use tends to focus in one area and repel dissimilar ones. (E.g. the location of factories could’ve been influenced by major transport route or canal and in this area, we’d expect to find a low level of residential building due to the noise and pollution which are generated – even if we do find any, it would be class residential.