Found in this investigation that caffeine levels drastically rise in the first hour and then rapidly

Authors Avatar

Mohammed Ishfaq

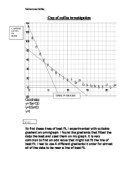
Cup of coffee investigation

To find these lines of best fit, I experimented with suitable gradient on omnigraph. I found the gradients that fitted the data the best and used them on my graph. It is very common to find an odd value that might not fit the line of best fit. I had to use 4 different gradients in order for almost all of the data to be near a line of best fit.

Join now!


By substituting the percentage of data in for the value of Y, I predicted how long it took for the caffeine levels in the body to reduce to: 80%, 50% and 40% of the peak value.

I predicted that it took:

  • Prediction for 80%

     80% of 130 = 104.

     104=-19x+130

19x=130-104

19x=26

 x=1.37(to 2d.p)

1.37 as an hour= 1 hour 22 minutes

  • Prediction for 50%

50% ...

This is a preview of the whole essay